POP! Data-driven graphic design
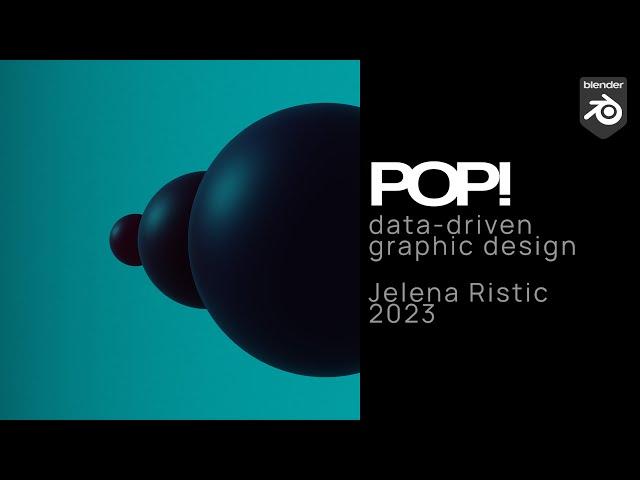
"POP!" is an attempt at graphic composition driven by certain constraints determined by data.
"POP" stands for "population". Each bubble represents a municipality in Switzerland. The bubbles are arranged on a plane according to the latitude and longitude of each place. That point determines the very centre of each bubble. The size of each bubble reflects the population of each location. In this video, we are inside the Zürich bubble, its boundaries being the translucent blue colour in the background.
"POP" stands for "population". Each bubble represents a municipality in Switzerland. The bubbles are arranged on a plane according to the latitude and longitude of each place. That point determines the very centre of each bubble. The size of each bubble reflects the population of each location. In this video, we are inside the Zürich bubble, its boundaries being the translucent blue colour in the background.
Тэги:
##blender3d #motion_graphics #Zürich #population #data #ZurichКомментарии:
THE MOST BROKEN HERO in 7.36C? - Abuse For Free MMR - Dota 2 Tiny Guide
GameLeap Dota 2 Pro Guides
POP! Data-driven graphic design
Jelena Ristic
Học Excel Cơ Bản 66 | Các phím tắt thông dụng trong Excel
ĐT Nguyễn [Học Excel Online]
Бичи в Майами Miami Bici (2020)
de tout sur tout


