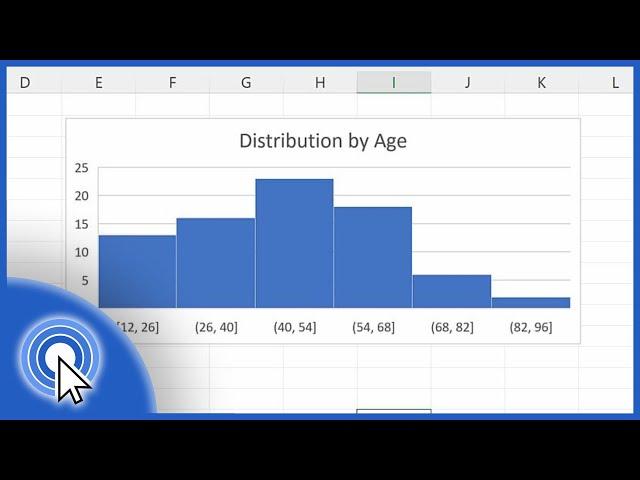
How to Make a Histogram in Excel
Комментарии:

Alexander Elfers - 04.11.2023 19:30
doesnt work for me
Ответить
Caleb Reid - 04.10.2023 21:10
Thank you, so easy to follow!
Ответить
Lexy Bexy345 - 13.09.2023 07:59
This doesn’t work…
Ответить
James Killings jr. - 19.08.2023 17:31
Very insightful
Ответить
Sleeperknot - 19.07.2023 10:27
I can't see "Insert Statistic Chart" option at all!
Ответить
Daniel Gillespie - 08.06.2023 05:47
Thanks
Ответить
Sallau Saidu - 29.05.2023 08:12
Very helpful. Thank you
Ответить
Aaron - 30.04.2023 04:20
My graph won’t even show up
Ответить
Kevin Small - 02.04.2023 16:22
Thank you !!
Ответить
Tube You - 15.03.2023 13:26
my excel is the newest version, there is no bin width selection, how can I change the x axis, it alway start 0
Ответить
Detective Thinker - 08.03.2023 16:26
This is a very good example! However, I don't know how to add the greater than equal to and the less than equal to symbol onto Excel.
Ответить
leo - 08.03.2023 11:49
i tried the add the data labels but it's not appearing :(
Ответить
maska - 01.12.2022 01:53
i keeep putting the god damn x axis in and it just disappears.
Ответить
Andrew Braven - 05.07.2022 13:42
How about you do tutorial in access
Ответить
Kybernetika není věda - 23.06.2022 10:22
Hi, who is the author of the intro and business cards. I really like them.
Ответить
nature and beauty - 15.06.2022 18:41
Nice🌻
Ответить
How to Make a Histogram in Excel
Excel Tutorials by EasyClick Academy
How to Update DSC on GST portal | Renew Digital Signature on GST Portal |
The Professional Analyst
स्कूल व्याख्याता 120 दिन कि सटीक रणनीति। दोनों पेपर एक साथ ऐसे करें तैयार। RPSC SCHOOL LECTURER 2024
SAHITYA SHIKHAR CLASSES साहित्य शिखर क्लासेज
I tried Frost Blades Of Katabasis
DireGray
EOB - Shangri-La
Ed O'Brien
Мем "МАМААА" на разных Скоростях!
HEROMANS STUDIO
DIYCHOOSE Diamond Painting Review #diychoose #diamondpainting
Lovecraftforever
ERIC GEISELMAN FOILING NEW SMYRNA BEACH
Foil Outlet


