How to create a Clustered Stacked Bar Chart in Excel? | Detailed Comparison | Space Efficiency
Select Clustered Stacked Bar Chart. Select your data. Click “Create Chart From Selection” button. You can create Clustered Stacked Bar Chart in a few minutes with a few clicks.
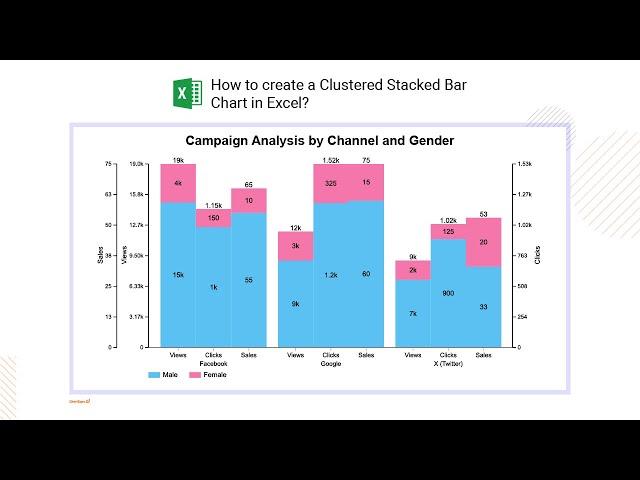
A Clustered Stacked Bar Chart is a type of bar chart that combines elements of both clustered bar charts and stacked bar charts. Here's a breakdown of its features:
1. Clusters: The chart groups bars together based on a categorical variable. Each cluster represents a different category.
2. Stacks: Within each bar, sub-bars are stacked on top of each other to represent different segments of a whole. Each segment is usually a different sub-category within the main category.
Example
Imagine you have campaign data for three different channels (Facebook(Meta), Google, X(Twitter)). You want to show the breakdown of views, clicks and sales by gender (male and female).
• Clusters: Each cluster represents a channel.
• Stacks: Within each bar (representing a gender).
Benefits
• Detailed Comparison: Allows for the comparison of both the total and individual components of categories.
• Space Efficiency: Efficiently presents detailed data without needing multiple charts.
Install ChartExpo charts add-in for Microsoft Excel or Office 365
https://chartexpo.com/utmAction/MTYrdXQreGwrY2V4cG8rNTI4NCs=
How to install ChartExpo add-in in Excel & Office 365 video
https://www.youtube.com/watch?v=cWKBUrdIW88
Install ChartExpo charts add-on for Google Sheets
https://chartexpo.com/utmAction/MTYrdXQrZ3MrY2V4cG8rNTI4NCs=
Explore more charts and visualizations
https://chartexpo.com/?source=YouTube
Video Summary:
This video explains "How to create a Clustered Stacked Bar Chart in Excel?". You can use the option of properties to enhance your charts.
Chapters:
0:00 Data requirements for a Clustered Stacked Bar Chart.
0:36 How to construct data for a Clustered Stacked Bar Chart?
0:56 How to create a Clustered Stacked Bar Chart in Excel from sheet data?
2:32 How to customize a Clustered Stacked Bar Chart using properties?
4:33 How to export a Clustered Stacked Bar Chart in JPG, PNG, SVG and PDF?
#chartexpo #datavisualization #datastorytelling #dataviz #visualization #charts #graphs #spreadsheet #excel #clusteredstackedbarchart
Tags:
Custom charts
Advance charts
Professional charts
Data charting
Data visualization tools
Excel graphs
Advance Excel charts
Excel data visualization
Excel Add in
Excel chart tutorial
Excel chart tricks
Impressive Excel charts
Build Modern Excel Charts
Multi axis clustered stacked chart
What are the benefits of clustered stacked bar chart?
Hybrid of two bar chart types: clustered and stacked
What is clustered stacked bar chart?
Excel Clustered column and stacked combination chart
Excel Clustered stacked column chart
Тэги:
#Data_visualizations #Data_storytelling #Charts #Graphs #Excel_Charts #Google_Sheets_Charts #Multi_axis_clustered_stacked_chart_in_Excel #What_are_the_benefits_of_clustered_stacked_bar_chart? #Hybrid_of_two_bar_chart_types:_clustered_and_stacked #What_is_clustered_stacked_bar_chart? #Excel_Clustered_column_and_stacked_combination_chart #Excel_Clustered_stacked_column_chart #detailed_comparison_chart #chart_with_space_efficiency #bar_chart #column_chart #stacked_chart #cluster_chartКомментарии:
RTX 3050 | Genshin Impact - 4k
Rasporilac
Идеальный ремонт у Юрия Розума Первый канал
Пантэк Сити Строй
Сделай это и станок будет служить вечно! #чпу #станок #производство
4PU pro | Ремонт станков
Лисы из Новолисья. Архив сториз 19.06.23
Новолисье / El Couguar Fox
Comer en París a MITAD DE PRECIO
Esto es Francia
Изменения для водителей с 1 января 2025
Автосправочная
CREEPY LADY…
Mr & Mrs Panda

![[K-Choreo 8K] NCT U 직캠 '90's Love' (NCT U Choreography) l @MusicBank 201127 [K-Choreo 8K] NCT U 직캠 '90's Love' (NCT U Choreography) l @MusicBank 201127](https://invideo.cc/img/upload/Y2J5cGtLdzlpeUw.jpg)
