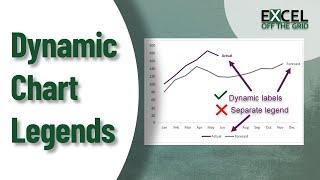
Dynamic chart legends in Excel | Make charts easier to read | Excel Off The Grid
Комментарии:

This is an excellent tutorial. Many thanks for sharing!👏
Ответить
Thanks for the tip. But still i wud prefer to add labels to my original line series. That way its more natural. As per my view.
Ответить
Interesting technique - thanks for sharing. As always with XL there are many ways to solve a problem. As an alternative, rather than using extra series, I would calculate the label similarly (using helper columns) but use the "Labels from cells" method of attaching these custom data labels to the existing series. Instead of using your IF() function to calculate a value, it would simply return the name of the series. Cheers!
Ответить
Awesome as alway Mark. This is fantastic!
Ответить
Great tip! I would simplify it a bit. In the Forecast Labels and Actual Labels columns you could simply write the texts "Forecast" and "Actual" instead of the max values. And then you wouldn't need to add additional series to the graph, you just need to add the data labels to the current series and point them to those column. Also you can edit the formating of the data labels so that they won't show 0 values (and not needing to add NA()). I enjoyed your video very much, keep it up! Thank you!
Ответить
Very creative idea👍👍. Thanks Mark
Ответить
Certainly the presentation of the graph is much more attractive that way. Thanks for sharing Mark. Excellent!!
Ответить
Great tip. If one created a chart starting in PowerPoint, does the chart function in PowerPoint support the formulas you outlined?
Ответить
Nice! but now I’ve got to go back and change all my charts😀
Ответить


