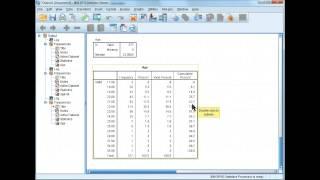
Splitting a Continuous Variable into High and Low Values
Комментарии:

Hi! James I am doin moderation analysis in amos ..
My question is how can I split my moderating variable

Can i have two variable high and low? If yes , can i run regression without having Coliniarity between variable?
Ответить
Hey, thanks for the video! I have a question: I want to split my data into 'high responder' and 'low responder', but I want to make sure that in each cell, there is the same amount of participants. For example, I want to have 25 low responders in group1condition1, 25 high responders in group1condition1, 25 low responders in group1condition2 etc. Do you have an idea on how to split my variables this way?
Ответить
Hello James, Thank you so much for this. I just want to ask you, My objective is "to find out levels of academic entitlement attitude of higher education students. for this I have used 5 point Likert scale having 15 items. Now how can I know how many students' having high academic entitlement attitude, how many low, and how many having moderated attitude.
Ответить
Hi. Thanks for this great video. Do you have any references for this median split method? Thanks.
Ответить
Hi, is this the same thing as defining a cut-off value for the variable?
Ответить
Does this mean you are making the continuous variable a dichotomous variable?
Ответить
You're still replying to comments....it's amazing 👍 awesome work
Ответить
Brilliant, thank you
Ответить
I love you for this.
Ответить
Thank you, I have just 1 question please. My median is 29 and the cumulative % = 51.7. Do I therefore include my median in the low values, so everything greater is in my high value? Or does 29 go in the high values? The value after 29 is 31 at 58.6 and the values before is 25 at 41.4%.
Ответить
My crops are watered, my skin is clear. Thank you.
Ответить
How do we do this with a Likert scale with different subscale items ?
Ответить
with syntax:
RANK VARIABLES=yourVariable (A)
/PERCENT
/PRINT=YES
/TIES=MEAN.
RECODE PyourVar (Lowest thru 50=0) (50.01 thru Highest=1) INTO medianSplitVar.
EXECUTE.

Hi I am not sure if you're available to help but I am trying to graph a moderation and was told to do a median split to get the high and low mean and sd of my variables and graph this. How would I go about this? Thanks!
Ответить
hello, not sure if you are still answering questions but I hope you are!! for my dissertation I am computing the median split for values ranging from 0 to 6. The median is 3. Do I include the values 3 in the split or not? i.e. do I create the low category with 0-2 values and the high category with 4-6 and ignore those with a value of 3? Thanks x
Ответить
How could I analyse trait anxiety as two separate groups (low and high anxiety) in an ANOVA?
Ответить
Hi James very helpful video. I was just wondering do you know how to split two continuous variables into groups?
Ответить
is this mean split?
Ответить
Hi thanks for the informative video. I have a question, in my dataset I calculated a Reliable Change Index of scores for the outcome measure (to measure clinical significance).
Now i want to create 3 groups, by dividing the continuous RCI scores into
1. one group that has an RC score bigger than 1.96
2. second group that has an RC score within 1.96 and -1.96
3. third group that has an RCI score smaller than -1.96
I'm btw only interested in the frequency of participants that are in the 3 groups.
So ideally, SPSS would give me an output like
(133 participants have RCI bigger than 1.96,
140 participants between 1.96 and -1.96, and 60 participants smaller than -1.96)
do you know how I can divide the groups this way (using sort of cut-off points)?

it is so best
Ответить
Hi James, I have a question that i wanted to ask you. it concern this concept of a dichotomous variable. Are you available to assist
Ответить
Really helpful!
Ответить
great thank you!! :)
Ответить
And how to split into three - low, average and high values?
Ответить
Hi James. Nice explanation but I've one small doubt. For my thesis, I used 4 attitude based items in 7 point Likert scale and I need to split this through using median split that measures high vs low attitude. How should I do that? because when I run the analysis, I haven't got equal values when I use the median split.
Ответить
Hi James, If I am using a scale with 8 questions (continuous) and computed a mean score for my scale to create a new variable (average mean score for each participant). Can I carry out median split for my new variable?
Ответить
Hi James, I am running a conditional pathway analysis and I am currently trying to decide whether to transform my continuous moderator variable (level of identification) into a dichotomous variable (high vs low identifiers). I have read different things about why this shouldn’t be done mostly because of the loss of information in the process. What would you say is a good argument to transform a continuous variable into a categorical one, i.e. when should or shouldn’t this be done?
Thank you very much for your help!

Hi is this basically known as the median split?
Ответить
Hello, if I am using a conscientiousness scale, would I still use this method to split the personality trait into two categories (high or low)?
Ответить
Hello, do i use this method for questions like this or is there any other method for spss?
Yes No
4.1 Do you have control for savings? 1 0
4.2 Do you have control for income? 1 0
4.3 Do you have access to money for your own? 1 0
4.4 Do you have control for loans? 1 0
4.5 Do you have control for cash expense? 1 0
Range: 0-5
Score:
0= no control
1-2=low control
3-4=average control
5=high control

I want to split my 7 point likert religiosity scale and categorize responses into high, low and middle group to be used in MGA AMOS. The middle group will not be used for analysis in MGA AMOS. Can I use this same technique on a 7 point likert scale as shown in your video? My median value is 3.33.
Do I have to take into consideration the nominal value of the 7 point likert scale in that logically, responses 1 to 3 makes up low group and 5 to 7 makes up the high group? I'm just confused on deciding which method to use.

I want to split nutrient food data (ex. high and low intake of milk). Do I still have to use the median value to split in high and low, or do I have to use the total maximum intake and split this value to get the right split?
Ответить
Thanks, you really helped me with my thesis =)
Ответить
i want to know how to create group of age. for example 25-30. 31-35. 36-40 etc
Ответить
I want to split an age variable by the median (into low and high age). However I have cases where the age value is the same as the median itself, so what do these cases get categorised as?
Ответить
Thanks for this! I have recoded my variable this way. My question is: I want to compare the low and high values on how they affect the dependent variable. How do I do that when they are still blended into one variable? (I realise the recoding is supposed to help and there's probably an obvious solution, but I'm not sure how to do that. I have only compared two separate variables before. I'd be very grateful for any tips!).
Ответить
This video was very helpful writing my thesis, but i still have a question to ask.
In lots of papers and videos which dealt with moderation effect in AMOS, they mostly divide a variable into two components (i.e. male vs female, high involvement vs low involvement).
Due to lack of samples, I'm currenlty trying to use rest of data as middle, after diving variable into high and low.
Is it possible to check moderating effect using three groups (i.e low, middle, high)?
Just as with using two groups, can i constrain them with similar method? (for example, a1 = b1 = c1 paths)

Hi James, this video is very informational. Thanks to you. I just have a query, here you have used a single continuous variable for splitting but, is it possible to split by the median, four/five continuous variable belonging to single latent variable by aggregating those variables. Can you please help me on this.
Ответить
Why use the median and not the mean? Do you have a reference for using the median
Ответить
Thanks very much for the help!
Ответить
if you want to run a correlation between these two variables, I would not split them.
Ответить
Once splitting the variable into High/Low how would I then run a correlation between eg, "high knowledge of UK brands" against another variable say "age"
Ответить
Thankyou! :-)
Ответить
Not that I know of. I would just describe it literally, "Variable x contains values for five possible group memberships: a, b, c, d, and e."
Ответить
Hi, thanks for your presentation. Very informative. I need to describe a variable manipulation where a continuous variable was split into 5 grps, for the purpose of inclusion as a MANOVA IV. How the groups were split is unknown, and not relevant to my discussion. However, I’m wondering what to call the split. Clearly it’s not a dichotomisation as it has 5 groups, not 2. Is there a term which is typically used to describe variable splits into >2 groupings? Thank you for your time.
Ответить
I'm very sorry. I still do not understand the problem. I'm sorry I could not be more help than this. Best of luck!
Ответить


