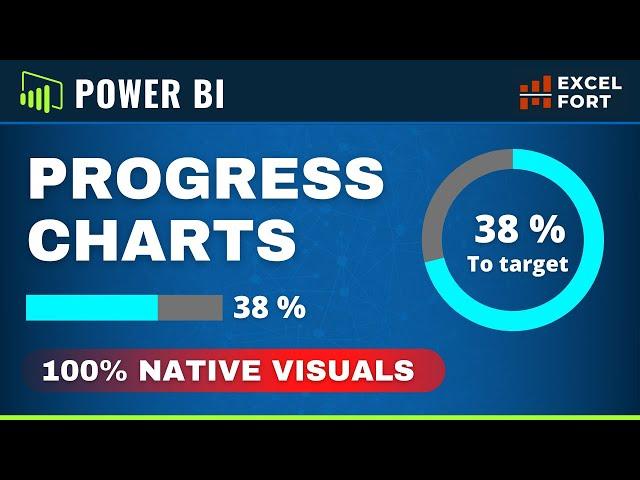
How to Make PROGRESS Circle and Bar CHARTS with NATIVE Power BI Visuals
Комментарии:

thanks very useful
Ответить
Thank you so much
Ответить
Crack, wonderful Video!
Ответить
thanks for the video)
Ответить
Wow! Many thanks
Ответить
This is exactly what I'm looking for, but how to calculate this if there are date-wise records for each segment (how to add them) and I have Monthly and Quarterly targets?
Ответить
Very, very useful! Exactly what I needed to get started on my dashboard. Thank you!
Ответить
Great Work, anyone Can send me PBIX File for this video ? Please
Ответить
Good morning ! Is it possible to change the color of the bar using a conditional ? When it is 100% the bar turns green. If it is between 70% and 99% it turns yellow. And when it goes below 70% it turns red. I made an average using SWTICH, but I can't apply it to this graph. Thank you very much in advance!
Ответить
Excellent reply in my reports, I thank you very much
Ответить
Incredible
Ответить
slick!
Ответить
this was great, thanks much appreciated
Ответить
Can you share the data file for follow along😕
Ответить
This is great. Thank you. Do you have a video that shows how to achieve a Stepper progress bar ?
I would like to illustrate where a project is (which stage). I have a column that has the stage name. Stages are predetermined and follow a certain order. Stage 1 > Stage 2 > Stage 3 > Stage 4.
The idea would be to show this kind of visual on a details page (drill down).

This is exactly what I want! Thanks alot for the inspiration!
Ответить
Awesome Sir
Ответить
Thank you very much!
Ответить
Very easy-to-follow guide. Thanks a million times for this.
Ответить
Excellent
Ответить
Thank you! I spent a day trying to figure out how to complete such a simple task. It was the % remaining with the max( negative) that I was missing. Also needed to the if statement for above target to switch… to make it completely understandable for the user when % remained or % was above target. Thank you so much!
Ответить
Excellent sir
Ответить
how have you added the remaining percentage please? not sure how to calculate in BI
Ответить
Très bien. Merci infiniment
Ответить
Very informative 👏thanks
Ответить
Love you man your videos is really useful and very understandable, MJ from Saudi Arabia ,keep it up 🌹👍🏻
Ответить
Very nice. That's what I exactly looking for. Please make more videos. Thanks.
Ответить
Awesome
Ответить
Thanks for sharing. Very interesting.
Ответить
amazing technique, please make more videos
Ответить
A fantastic learning video and sure is helpful for dashboarding. This will be great getting the PBIX file. Thanks.
Ответить
Great stuff!! Please make more videos on look and feel/ formatting please
Ответить
Great content!! Thanks for share useful idea.
Ответить
Thanks Sir very helpful
Ответить
can share page setting please
Ответить


![РЕАКЦИЯ МАМЫ НА [Глад Валакас - Енотик - Полоскун; эй Богдан] РЕАКЦИЯ МАМЫ НА [Глад Валакас - Енотик - Полоскун; эй Богдан]](https://invideo.cc/img/upload/NFQ0Wk0yMHVtS3c.jpg)
![Saitama VS Superman - EPIC BATTLE PIXEL [EPB SEASON 2] Saitama VS Superman - EPIC BATTLE PIXEL [EPB SEASON 2]](https://invideo.cc/img/upload/MDFnLTRoZGNVMzE.jpg)


![[60 FPS, 4K] Donkey Kong Country 1/2 - RareWare logo remastered [60 FPS, 4K] Donkey Kong Country 1/2 - RareWare logo remastered](https://invideo.cc/img/upload/d0Jic1RRcDNlNGw.jpg)


