Комментарии:

@hichamlaalaoui277 - 07.10.2023 21:14
hello, what if the the KPI must be less thant the target? target < 30000? thanks bro
Ответить
@dhakafady774 - 21.08.2023 18:49
sir , please correct the sound quallity ,
Ответить
@tanweerabbasabbas649 - 04.07.2023 20:21
Yes color does change but no sparklines appearing as i can see in ur video
Ответить
@tanweerabbasabbas649 - 04.07.2023 19:59
Values showing but no sparklines!!!
Ответить
@tanweerabbasabbas649 - 04.07.2023 17:48
Coloe changes automatically?
Ответить
@jahabarsathikhakeem488 - 16.04.2023 10:29
Thank you. It is very useful video
Ответить
@IarukaSkYouk - 25.03.2023 21:10
make more videos bro I hope to learn more from you :)
Ответить
@bodyart1460 - 01.03.2023 14:11
thanks
Ответить
@7urbine - 25.02.2023 21:33
Straight forward and to the point. Thank you!!
Ответить
@Nani-et7gk - 19.11.2022 20:20
👍🏻
Ответить
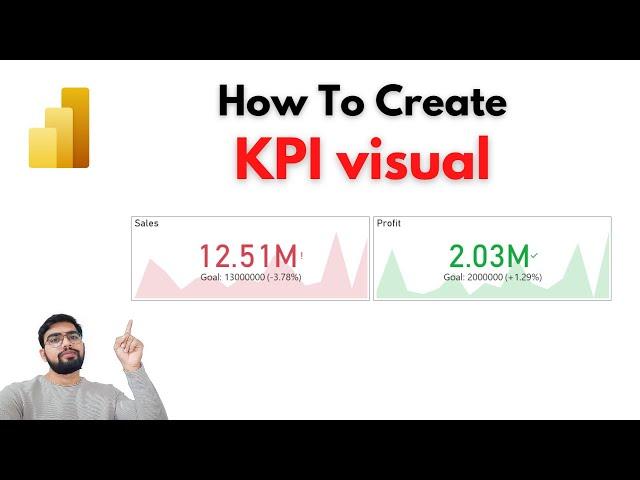
How To Create a KPI visual in Power BI
BI Tricks
Прохождение Far Cry Primal — Часть 10: ЗАХВАТ ФОРТА
Дмитрий Бэйл
Riding Japan's Train that Feels Like a Spaceship | Laview 🪐
Experience JAPAN
Fastest Sprint Speeds in Football
Magic of Football ᴴᴰ


