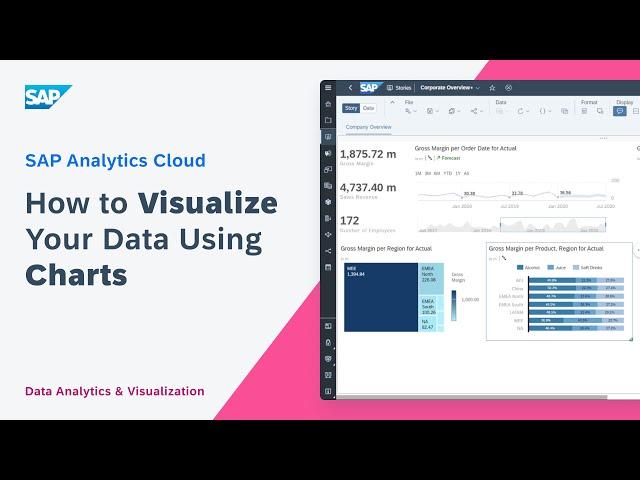
How to Visualize Your Data Using Charts: SAP Analytics Cloud
Комментарии:

@kevinmeng3215 - 07.12.2021 18:20
hello, how can I get the sample data used in this video?
Ответить
How to Visualize Your Data Using Charts: SAP Analytics Cloud
SAP Product Help and Training
Postpartum Pilates Workout For Tight Tummy & Round Booty | 30 Minute Postnatal Pilates
Pregnancy and Postpartum TV
Interview with Jan from DUTCH REFEREE BLOG!
Referee POV
Top 5 MMORPG I Played In June 2021
Gaming Hardcore
Types of Mortar || Key Points || Civil Engineering
Structural Engineering
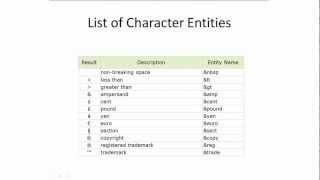
How to display Special Characters in HTML
Internet Services and Social Networks Tutorials from HowTech
DIVER Reacts To Missing TITANIC Sub Story…
True Geordie
[Medit K.O.L] Dr. Armen Mirzayan
Medit Company
OpenFGA Deep Dive
GluuStream


![[Medit K.O.L] Dr. Armen Mirzayan [Medit K.O.L] Dr. Armen Mirzayan](https://invideo.cc/img/upload/czlBcFhOY2cxVzU.jpg)


