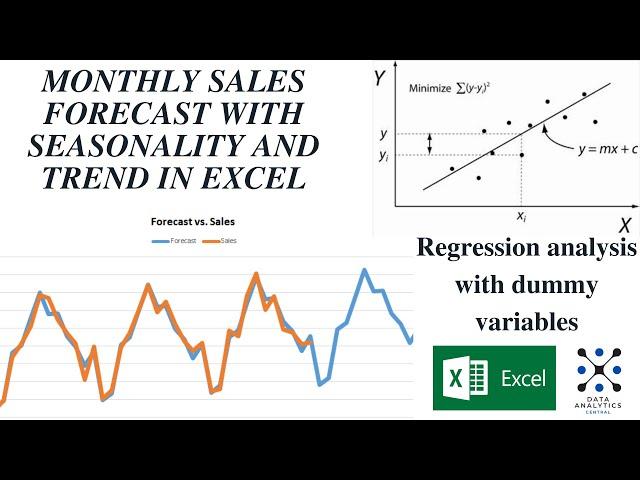
Monthly Sales Forecast with Seasonality and Trend - EXCEL regression with dummy variables
📊 In this step-by-step tutorial, you'll learn:
1️⃣ The fundamentals of regression analysis in Excel, leveraging the powerful Data Analysis Tool Pack.
2️⃣ How to effectively capture and incorporate seasonality into your sales forecasts using dummy variables.
3️⃣ The importance of recognizing and accounting for trends in your data to make more accurate predictions.
4️⃣ A deep dive into Winter's Smoothing Method, demystifying this widely-used forecasting technique.
5️⃣ Practical tips and best practices to ensure your forecasts are reliable and actionable.
Sales forecasting is a critical aspect of business planning, helping you make informed decisions on inventory management, resource allocation, and overall business strategy. Whether you're dealing with historical sales data, financial planning, or simply want to gain a deeper understanding of predictive analytics, this tutorial will provide you with the knowledge and skills you need.
===== CHAPTERS =====
2:01 - Create the Dummy Variables
3:31 - The Regression tool in Excel's Analysis Tool pack
7:01 - Create the Regression Model
10:00 - Visualize with Excel Chart
#ExcelRegression #SalesForecasting #DataAnalysis #DummyVariables #WinterSmoothing #BusinessAnalytics #ExcelTutorial #DataScience #TrendAnalysis #SeasonalityForecasting #BusinessIntelligence
Тэги:
#Statistics #Excel #Regression #DummyVariablesКомментарии:

Sir, could you please explain us why we have to lock 🔒 intercept, please explain and please explain me about p value.
Ответить
Sir what If we have Jan to March instead of Jan to Dev
Because of I have value from Jan to March and when I am doing the method the out is not showing right could you please give me a hint

I would like to thank you so much
Ответить
and also, why you used three years data? what will be wrong if I use two- or four-years data?
Ответить
I think residual should be zero or close to zero! right? but in your case it is too much; so, can we say your forecast is good?
Ответить
Hello Sir
Where can I get the Excel worksheet to follow your presentation. Thanks

Thank you for the video, it is really helpful!
Ответить
so "t" is for trend and "jan" thru "nov" is for seasonality. am i correct
Ответить
Hello! Don't know what I did wrong but when I tried to use the Regression tool in Excel's pack, it said "The number of rows and columns in X range cannot be the same."
Ответить
Excellent sir. Can we use the same process for 5 year forecast. Please do reply sir
Ответить
Its giving a biased forecast line
Ответить
Great video, is very usefull, thanks. i have a question, why dont use december when you transpose the months?
Ответить
why time period t is used ?.
Ответить
why don't you use December?
Ответить
How we can analyse the forecast with second order linear function with seasonality.
Ответить
why dummy variable was used
Ответить
Great work! Solved a problem I have been working on for days.
Ответить
Simple and elegantly presented. Was working on a forecast and other descriptions online were abhorrent to say least. The error range was HUGE, but thanks to you my standard error reduced to 2%. Asante Sana!!!🤗
Ответить
What about daily forecast, how do we create matrix?
Ответить
Hey, what if we have to forecast yearly sales. How many years would we need to enter as the dummy variable ?
Ответить
Hello. When using this method, Excel is showing the value function but I don't know what I did wrong. Any idea?
Ответить
Is is usable for other figures like ebt, ooe, etc?
Ответить
Thank you for great content!
What if we would like to add another variable - i.e., a change in product prices (let's assume cyclical price increases, as well as occasional promotions, for example, for a month of time)? How would your model then need to be modified?

would you mind explain, why to exclude the last month on your dummy variable?
Ответить
interesting example. Science based :) What do you think about latest forecast functions included in the "pack" =FORECAST.ETS.SEASONALITY()?
Ответить
Great content explained in detail! Amazing!
Ответить


