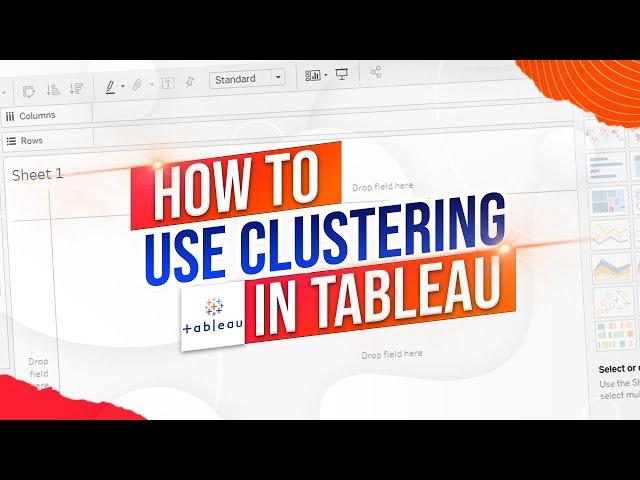
What is Clustering and How do You Use it in Tableau
Subscribe: http://bit.ly/3i3WN4p What is Clustering and How do You Use it in Tableau
In order to demonstrate clustering in tableau we're going to need to build a scatter plot let's drag sales to columns and profit to rows.
That's going to give us one mark on a scatter plot. In order to expand that out to all the marks available in the data let's click on analysis and uncheck aggregate measures.
We have a scatter plot in order to Cluster these marks. I'm going to click on the analytics pane drag cluster to the middle of the screen.
Tableau is automatically going to Cluster by the two measures that are in The View and give an automatic number of clusters. I can adjust this by at either adding measures or moving measures or changing the number of clusters.
In this case I have five clusters based on sales and profit. You can describe the cluster as well and see the model that's used to build it. If I click on clusters drop down and click describe clusters I get a summary of the model and information used to build the Clusters. Behind the scenes it is a k means model hope this helps
Тэги:
#Clipchamp #Online_video_editor #Tableau #Data_Science #Business_Intelligence #Analytics #Developer #tableau_real_time_interview_questions_for_experienced #365_datascience #tableau_visualization_projects #tableau_basic #tableau_project #tableau_interview_questions_and_answers #bi #tableau_full_course #tableau_data_analyst_certification #tableau_tutorial_for_beginners_free #tableau_visualization_tutorial #business_intelligence #tableau_projects #tableau_visualizationКомментарии:
What is Clustering and How do You Use it in Tableau
Ynteractive Training
f4 thailand cut
SL Mindy
WHEN A NOOB TRIES SNIPING IN WARZONE MOBILE...
ExxotikGaming
Indonesia passes new criminal code, outlaws sex outside marriage
Al Jazeera English
MMA Project
NewQualityMusic
Угол из кирпича!
masterkladki

![10 Best Lightroom Presets [2021] 10 Best Lightroom Presets [2021]](https://invideo.cc/img/upload/c194TzhRNHhNSjM.jpg)

![How To Play Arknights Integrated Strategies [The Basics] How To Play Arknights Integrated Strategies [The Basics]](https://invideo.cc/img/upload/Y1EzVW1ZWTA0X3E.jpg)




![Unturned Deadzones | Russia Map [Normal] | Thanks For The 300 VIEWS! ON THE CHANNEL!! Unturned Deadzones | Russia Map [Normal] | Thanks For The 300 VIEWS! ON THE CHANNEL!!](https://invideo.cc/img/upload/WUd1U0ZSbDBZbDI.jpg)
