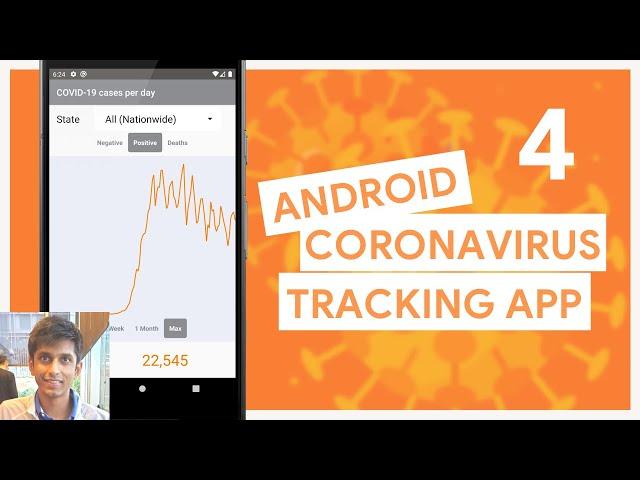
COVID-19 Tracking App (Robinhood Style) Ep 4: Render Spark Line Chart - Android Studio Kotlin
Комментарии:

Awesome
Ответить
Unfortunately, android direct view binding has been deprecated. So I have to use use view binding from ActivityMainBinding.
Ответить
Strange got everything working like the graph and the day but I'm getting 0 for the new cases, any thoughts?
Ответить
Thank you for this tutorial the only issue had to add in build.gradle app under plugins id 'kotlin-android-extensions' and import kotlinx into MainActivity.kt for to work.
Ответить
So by when will this series get completed ? i mean building partial code every other day doesn't sound that good , can you please provide the final source code before the series completes to make the building process a one-time grind for us ? nice content so far though !
Ответить
Please make a video on how to consume GraphQl api with Apollo using MVVM and coroutines with repository pattern
Ответить
![[원피스 트레저 크루즈] One Piece treasure cruise 원트크 엔마 조로 귀기 구도류 아수라 발도 망자의 장난 필살기!! #shorts [원피스 트레저 크루즈] One Piece treasure cruise 원트크 엔마 조로 귀기 구도류 아수라 발도 망자의 장난 필살기!! #shorts](https://invideo.cc/img/upload/ZzdqMjlUSmZUdzE.jpg)


