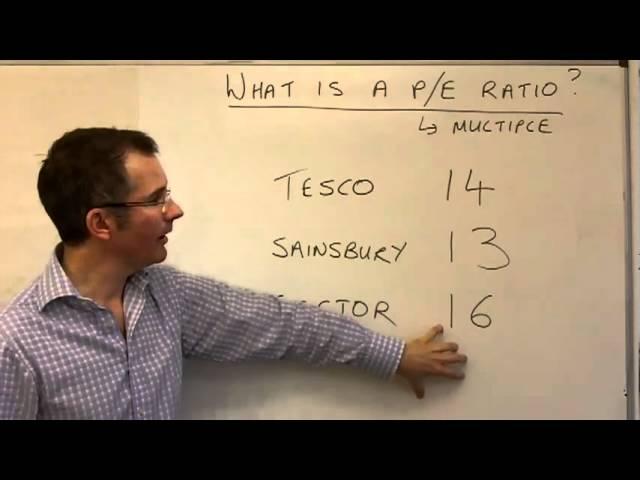
A beginner's guide to p/e ratios - MoneyWeek Investment Tutorials
Комментарии:

THANK YOU
Ответить
Wonderfully explained! Thank you for posting
Ответить
Brilliant video. Thanks Tim!!
Ответить
And to think a share in Tesco as of 2020 is now £234....
Ответить
So easy to understand. Thank you!!!
Ответить
Watching this while Tesla's PE is close to 500.
"Mad ting!" ... according to Caribbean people. Lol

Thank you for this. I'm taking the u.s. finra exam and this was very well explained
Ответить
Awesome video. Thanks!
Ответить
Although this is probably 8 years too late looking at the Tesco price this morning the answer to your question is yes. You definitely want to have bought the share price at £4.20! Great videos by the way, I just about watched all of them.
Ответить
£4.20? 👀🍁
Ответить
Helped a lot, thank you
Ответить
Well explained video sir, Mr Romero pieto trades on my behalf due to my tight schedules and he is indeed absolutely doing great, my last investment of $5000 he gave me my ROI of $28,380 in a period of two weeks of trading isn't that amazing.
Ответить
Such a good video !! Learning loads !! Thank you Tim Bennett
Ответить
I have undertand
Ответить
Tesla's current P/E is 1600 today.....
Ответить
I why is the P/E ratio different when you do
price per share/earnings per share
Vs
Market Cap/Revenue
What am I missing?

Very informative videos. Thank for taking the time to visually explain these terms. It makes a huge difference when you see it on a whiteboard.
Ответить
P/E Ratio = Understood, Thank you so much Tim
Ответить
This is the best explanation of PE ratio I've seen and heard. Thanks 👍
Ответить
excellent video, I am doing CeMAP and this was a great explanation.
Ответить
10 years later and still the best explanation
Ответить
I find I follow the most on your videos when you explain it asking the questions I as an investor should ask. That's what makes it click for me. Other videos do not explain it from the side that my mindset should be thinking... Kudos to an approach that works for me!
Ответить
Good explanation
Ответить
SPOT ON
Ответить
what if the EPS is negative? :)
Ответить
Great explanation. Not so great audio.
Still very helpful overall though. Thanks.

Tesla p/e 600 😂
Ответить
Tesla pe is 600
Ответить
I wish I had bought and still held tesco shares for £4.20
Ответить
Thank you!
Ответить
excellent video ,explained very nicely
Ответить
No way he predicted Boohoo
Ответить
Tim in a league of his own with explaining this jargon
Ответить
Before this, I felt I was a beginner after this I am feeling I am an expert :) thank you
Ответить
Very well explained and presented. Tesla is a good example of a high PE but investors believing sky rocket earnings
Ответить
I'm an A level business student and you explained this wayy better than the text book 😭👍
Ответить
Are we supposed to use Basic or diluted EPS? And why so?
Ответить
Sound sucks, sorry
Ответить
thank you sir. wish my commerce teacher explained it like that
Ответить
But, but, but... earnings per share don't equal dividends. It's possible, isn't it, that a company could have a great p to e ratio and still not issue decent dividends and that after 5 years of holding onto the shares the share price could be roughly what you paid for it? So, aren't there better indicators to look at before deciding to buy into a particular company?
Please forgive my naivety - I'm pretty new to all this.

how could ya'll hear him?
Ответить
Fantastic, id love to learn more from this bloke well done fella top lesson
Ответить
@Moneyweek
I asked Chat GPT this:
"Can you simply divide market cap by net income?
No, dividing market capitalization by net income will not give you the same result as the Price-to-Earnings (P/E) ratio. The P/E ratio is a financial metric used to evaluate the valuation of a company's stock relative to its earnings, specifically its net income.
The formula for the P/E ratio is:
P/E Ratio = Market Capitalization / Net Income
However, there is a key difference in the components used in this formula:
Market Capitalization: This represents the total market value of a company's outstanding shares of stock. It's calculated by multiplying the current stock price by the total number of outstanding shares.
Net Income: This is the company's total earnings after deducting all expenses, taxes, and interest. It's a measure of the company's profitability.
When you divide market capitalization by net income, you're actually performing the reverse of the P/E ratio calculation. In other words, you're calculating how many times the company's net income fits into its market capitalization, which doesn't provide the same information as the P/E ratio.
To calculate the P/E ratio correctly, use the formula provided above, dividing the market capitalization by the net income. This ratio gives you an indication of how many times the market values the company's earnings, which can be used to assess its relative valuation compared to other companies in the same industry or sector."
Is it just me, or is it just contradicting itself, does anyone have a better answer of why you couldnt just divide Marketcap by net income (the per share just cancels itself out doesnt it?)

Non of these rules apply to mega cap tech stocks. Nvidia is 112 !
Ответить
Wow, This is 12 years ago. Whiteboard is timeless. Thanks 🎉
Ответить
'We don't want Rubbish'😂
Ответить
hand down the best guy on these topics !
Ответить
It is such a relief to see something made for subjects of the United Kingdom rather than American citizens in this genre.
Ответить
13 years ago this guy just decided to help me 😂
Ответить

![[Free] Amo x Safraoui Type Beat „AMG" [prod. Bastikoko] [Free] Amo x Safraoui Type Beat „AMG" [prod. Bastikoko]](https://invideo.cc/img/upload/QURWUUU0VXV5YXU.jpg)


