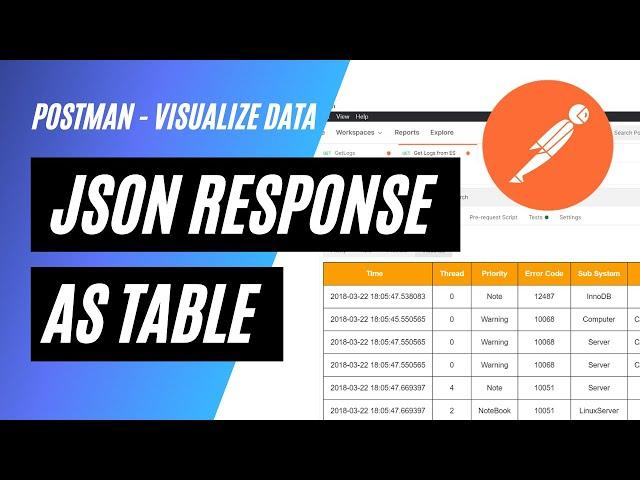
Visualize Postman Responses as Tables | API Testing
Комментарии:

@AshwinKumar-ut6fq - 30.06.2021 18:39
gud
Ответить
@sathyanarayanasr3043 - 30.06.2021 19:45
Vaalthukals da Dharanee ❤🔥
Ответить
@sarand9448 - 01.07.2021 06:30
🔥🔥🔥
Ответить
@vigneshj.p.158 - 01.07.2021 13:35
Really nyc explanation Darani. Wil b very useful
Ответить
@prayriesinha5182 - 06.04.2022 15:18
sir can you teach elasticsearch visualization with grafana while taking care of timestamp
Ответить
@arunah - 25.07.2022 09:20
Thanks @Darani, I have a question. If the response of an api is JUST a file (.xls), how to save that in Postman?
Ответить
@ajithkumar-gi3gi - 27.09.2022 15:40
Can u pls give us a detailed video??
Ответить
@pimpomfossils - 22.02.2023 13:57
You didnt mention how did you get the variable {{ }} in template variable
Ответить
@satishtesting19 - 17.04.2023 06:20
how to download the visualize report to html ?
Ответить
@alaaataa7366 - 24.08.2023 15:26
Good effort thanks 🙏
Ответить
harga aerox terbaru
Pomen Bocil
Da Map of Sri Lanka
Delicious Travel by Mrs Robinson
Drake x SZA - Slime You Out (Cover)
Chenny Britt
SLUB Internals for Exploit Developers - Andrey Konovalov, xairy.io
The Linux Foundation
Setingan Set Top Box, yang masih baru
margono teknik


