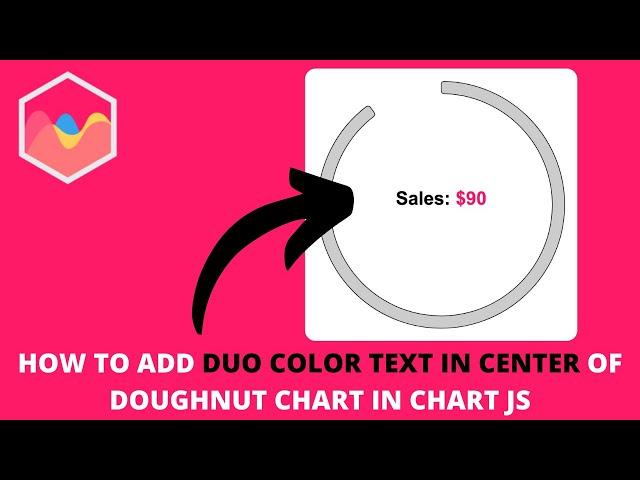
How to Add Duo Color Text In Center of Doughnut Chart in Chart JS
Комментарии:

Can we hide this custom label using on hover event?
Ответить
First of all thanks for all your educational video's. I have watched dozens of them the last month.
This is an interesting video.
I want to style the default tooltip which currently uses an array with push to get multiple lines with information from one dataset.
I want the values to be bold, so in the tooltip I want to create a bold font for: C, 40%, 49998 MB and 8416 MB
Drive: C
Free disk space: 40%
Total disk space: 49998 MB
Free space: 8416 MB
Could this duo color text method be applied to the default tooltip?
I am aware of the HTML tooltip (did not test it yet) because I expect all kinds of other difficulties with the HTML tooltip, like positioning the tooltip, positioning the arrow down, tooltip getting behind chartarea etc.


