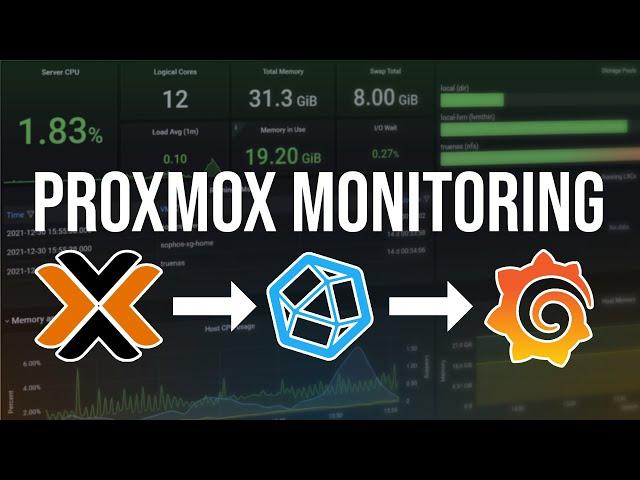
My new Proxmox Monitoring Tools: InfluxDB2 + Grafana
Комментарии:

Hi! Awesome video. Thanks!
Ответить
zabbix +1
Ответить
Returned to this video and completed my initial set up of InfluxDB2 with Grafana for my Proxmox server. Always good to use your content for reference. Thanks!
Ответить
Danke Christian, kurz und bundig. Ich habe so lange gesucht nach einen weg. Dies ist genau was ich gesucht habe. Viele Grüsse aus Holland
Ответить
if you had Home Assistant, you would not have to install extras for Proxmox - influxdb and grafana are "the must" for home assistant ;-)
Ответить
can we get the installation doc's for Ubuntu
Ответить
Looking at setting this up at the moment. For the self-signed cert issue, could you get around that by using traefik, or is that a bad idea?
Ответить
amazing video!!! I really need to get this deployed!
Ответить
Bruh you are not explaining anything, this is the worst tutorial I've ever seen
Ответить
Just have to say between this and the SSL video, you have helped my step up my game in my homelab HUGE! Thank you for everything you do and bring to the community!
Ответить
good。
Ответить
Hi thanks for the great video, have you managed to setup proxmox and nginx pm ?
Ответить
Great video, you keep going off topic so its hard to follow, you start talking about something and then start clicking on settings etc just a bit hard to follow sometimes
Ответить
Dear Team, Any update on the Grafana 9 Video Full Tutorial. I understood you are helping the poor public who unable to pay for learning but wanted to get a good job to fill their stomach and well establish in society. My heartly humble request, think for a Windows or Linux Server Admin , They do not have data scientist knowledge to run the latest Grafana 9, Influx DB, Prometheus software's but you can make video from ABCD label (Titbit knowledge). without keeping anything secret/hidden, so that they can learn fully., They can create the minimum all type of device connected for monitoring , Please make 100 type of ready made templates for Windows, Linux with alerting, so that they can use directly in their live environment . I am on of them. Thank you, your well wisher Bibek Kumar...👍🙏
Ответить
If you make an API token with read permissions only on the bucket where you store proxmox data the dashboard opens in the right bucket straight away. If you use the admin api token you'll also have access to the default buckets of influxdb like _monitoring and it will default to that.
Ответить
Great Video, just what I was looking for....
Ответить
can i get cpu temp ?
Ответить
非常有趣,学习一下。👍👍👍
Ответить
Awesome! Works great in few minutes.
But have you find any native way to include SMART metrics to the flow?
I found a way by installing telegraf with a smart plugin but i'd like to avoid installing something to my pve. I try to keep it as clean as possible.
As to SSL tutorial, sure that will be very interesting. Such an important topic!

Hi... Because of the SSL Connection from Grafana to influxdb, the hostname within the certificate is the one thing, but you also need the ca.crt itself in the root of the grafana container, don't you?
Ответить
Great now I need to figure out how to get data from sensors for example so I can get temperatures aswell :)
Ответить
Thanks for this great video.
I have an issue though when displaying the dashboard. Here are 3 errors showing up:
Templating: Failed to upgrade legacy queries e.replace is not a function
Templating [Bucket]: Error updating options: e.replace is not a function
Templating [server]: Error updating options: e.replace is not a function
Any idea where this could come from?

Amazin stuff! thank you!
Ответить
Been loving your videos so far...
After watching this one for a while, one thing kept bugging me....
What's holding that mic up??? Are you a wizard and using magic? :) Nice setup, since I can't see what's holding it up :)

Hey, I'm wondering if Grafana's docker image has brute force protection by default? As much as it is stated as such on their website, just trying to "brute force" it myself conflicts with this. I'm never actually blocked or anything.
Ответить
Thanks very much for your nice work
Kindly what advantages to use Proxmox instead of Prometheus ?

thank you!!! its working but now I saw that TrueNas can use graphite with influxdb and grafana aaannnnddddd its now unsupported since influxdb v2.0 :( what can we do now ? how to add graphite to docker and make it working with influx or directly with grafana ? Im not an IT for your information.
Ответить
Zabbix
Ответить
Again. Packed with tons of useful information and background knowledge. Thank you Christian.
Ответить
good tutorial, thank you for that! i'l be wait video about ssl!
Ответить
Great video as always thanks.
SSL certs (self-signed) for homelabs will be great ! I always wondered how to move self signed ssl cert and root ca certs for trust on all devices so eveything is nice and trusted in the end from everywhere at home. I can think of manual methods but if there are any automation available will be great.

Is it possible to install InfluxDB2 on my Proxmox server and still have it run like you are showing?
Ответить
Great Video, I've followed along and was able to get this setup and monitor my 3 homelab ProxMox servers! Thank you for the time and effort!
Ответить
Thanks for the great tutorial! To reach a larger audience, I really want to see non-automatic subtitles. I'm watching from another country, and I don't speak the language, but subtitles help a lot!
Ответить
Thanks for the reference to the grafana dashboard, I already had the metrics in influxdb since quite some time, but couldn't find a dashboard I liked, now I do. :)
Ответить
Könntest du auch eventuell deutsche Videos machen?
Ответить
excellent used this to create a CT in proxmox to monitor my servers
Ответить
Wonderful. Thanks for showing this. I abandoned InfluxDB a while ago, nice to see that version 2 does work well here. I´ll put a influx2 docker container on my to-do list.
Ответить
Absolutely would love a deep dive into SSL both self signed and with Traefik!
Ответить
Great video Christian!
Ответить
End your virtual disk?
Ответить
This is Awesome!! been wanting a nice grafana dash for proxmox but had no idea how to begin to build one myself
Ответить
I did same few days ago but it’s great you made this video 😀
Ответить
Hi Cristian, The SSL tutorial would be great!! Very helpful also the different types of cypher protocol ECDSA TLS ecc.....
Good video as always!!. Thanks

@The Digital Life thank you for your video, I did enjoy it.
I am sharing some thoughts here:
1. You mentioned, that you will create a separate video for SSL, certificates, I m interested in this video and looking forward to watching it. Thanks in advance.
2. Is there another tool for monitoring the VM from inside the VM's standpoint of view? On the contrary with your current video and illustrations are very good and interesting of course, and it would be monitoring the hypervisor data about those VM, but not about processes running inside the VM.
I wondering about a tool to use with Grafana and Prometheus to display information, which you get the different processes running inside VM, the most CPU intensive process inside the VM, and the most RAM intensive process inside each VM or LXC, etc.
Here guys, here, everyone,
What do you think?,
Do you think would be interesting or of some advantage to monitor from inside the VM standpoint of view? or not? and why not?
Thanks in advance.

yes, please make a video for SSL certificates 📌- great videos !
Ответить
Very good and professional video Christian and very nice and usefull content - thanks a lot for your time invest :-)
Ответить


