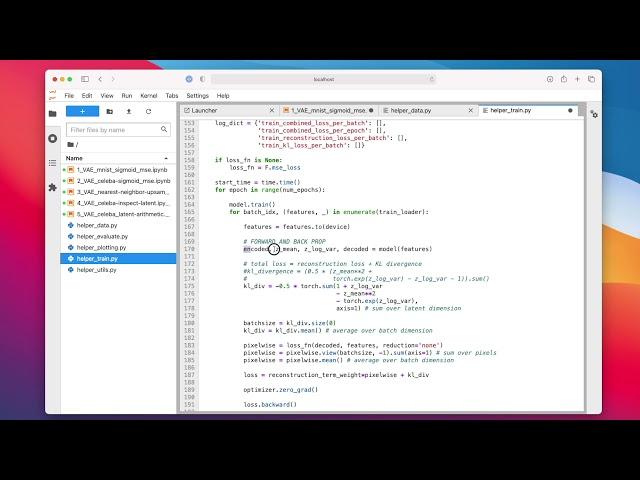
L17.5 A Variational Autoencoder for Handwritten Digits in PyTorch -- Code Example
Комментарии:

thank you for the video! What's the formula of backpropagation? I did not see the code of backward propagation part.
Ответить
running the code on google colab it shows error in model.to(DEVICE ) part how it can be corrected???
set_all_seeds(RANDOM_SEED)
model = VAE()
model.to(DEVICE)
optimizer = torch.optim.Adam(model.parameters(), lr=LEARNING_RATE)

Thank you for the lecture. If we sample from a multivariate random normal distribution (to decode and see what numbers we can get), then will we be more likely to decode some digits over others due to the nature of the distribution we are sampling from? And so based on your 2-D plot, would we get the digits at the center more often than the ones on the periphery?
Ответить
Hi Sebastian, I like your Videos, I has helped me, but am working on a personal project on Variational Autoencoders using Dirichlet distribution, and am stuck at the point of calculating Binary cross Entropy loss, I would kindly like to request for assistance
Ответить
First of all, thanks a lot! The scatter plot really gives a nice intuition about latent space.But it got me thinking that will every 2d space trained will look like this, or will it depend on how someone has made architecture or trained it.Then I saw your plot it was different from mine so I guess its not universal then. If it was universal it would be like a huge thing!
Another thing that we are trying to learn the probability distribution if I'm not wrong I wanna know and visualise the distribution that our network has learnt how can we know that, its in 2d so it can be visualised in 3d graph.

Thank you for hand holding the DL aspirants to reach new destinations, Great Service to the Knowledge
Ответить
Your video is really amazing. Thank you very much for giving us so much knowledge. Can you please tell us how can we get the validation loss evaluation curves?
Thanks :)


