Комментарии:

Not clear at all
Ответить
Good video
Ответить
Great video!!! Thank you so much!!! I love your channel!!! o(^^O)<33
Ответить
Great video
Ответить
Thanks for the video!
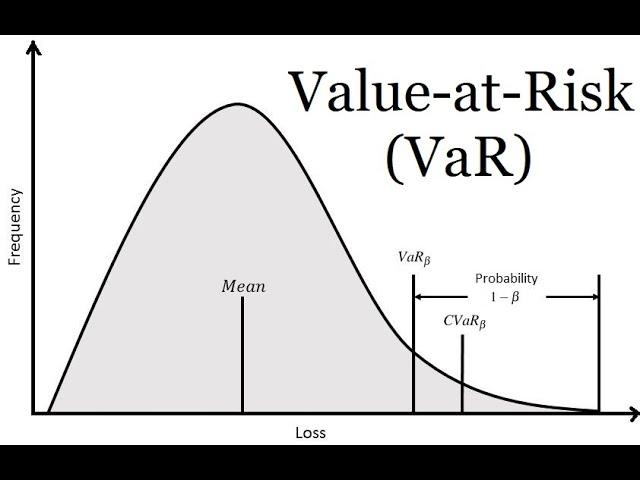
Sharing my Darwinex account and trades on my channel, this helped me to get a better understanding of how VaR works :)

Videos of cats have millions of views and this has less than 100k, what is wrong with the world lol, great video thanks for the info :)
Ответить
And how does it works with optimization? Thanks you!
Ответить
Thancs for this video; i expect to see more videos of this course especially with quantitativa examples.
Ответить
Can you plz clarify: for the example of day the equity plotted represents the number of days having an equity between a% and b% for example. Then in a week it becomes the number of weeks having an equity between a% and b% for example. And how it is plotted a sa normal distribution next?
Ответить


