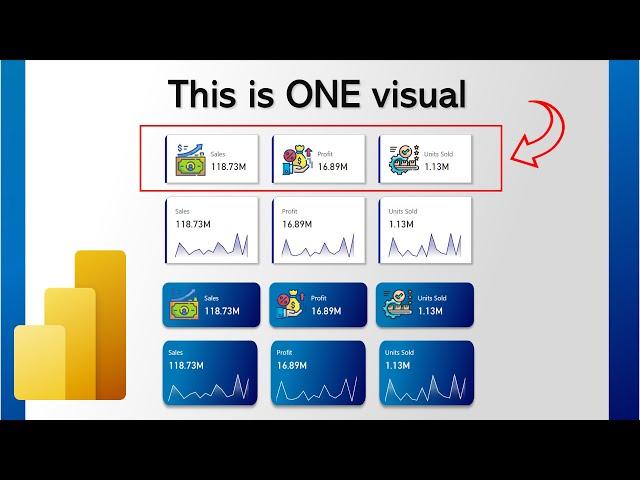
New Card Visual Tutorial - Power BI (June 2023 Update)
Комментарии:

I didn't get the option enabled in image portion
Ответить
Excellent video buddy!
Just subscribed

I have 5 hours left for a demo and this tutorial ... saved my day ... amazing..!
Ответить
Superb, thank you.
Ответить
Loved the ctrl shift L trick!
Thanks!!

Is it possible to rotate the card in power bi rather than I being horizontal?
Ответить
Great tutorial by a great person
Ответить
❤😊
Ответить
Excellent one, Thanks a lot for taking time, really useful!
Ответить
Does this store image on third party site which created from Kerry site as measurement?
Ответить
How did you select the 3 SUM_Gross_Sales at the same time 🤣
Ответить
Thanks Injae, a warning to users, if you add the image but nothing happens, you may need to adjust the image size, an option that is just below the image url setting. For some reason my defaulted to 0 and I couldn't work out why I couldn't see it!
Ответить
Hi, and thanks for this tutorial. For me, the image doesn't show up in the card whereas i followed the measure and the URL Image format ? Any guess ?
Ответить
how did you select all gross sales and replace them at the same time? always had to copy and paste mine :(
Ответить
Great Tutorial
Ответить
Wow great u explain easy way although i am thinking i will need to learn this code but u save time and tell us without learn code u can do this that great👍
Ответить
Very cool, thanks for showcasing this.
Ответить
excellent tutorial
Ответить
You sir, are a legend. Contrary to the usual PBI wizards out there with their zany and loud videos, yours was a pleasure to watch. Keep on keeping on!
Ответить
I liked it and learned something new. Awesome.
Ответить
Nice video with good detail explanation.
Thank you very much!

Thanks, I like this :)
Ответить
Thanks for a very helpful video! Is this possible to achieve for a Sparkline added to a column in a table/matrix table. Also, will this work and appear the same when uploaded and viewed in the service?
Ответить
Can you please provide a link for finance data?
Ответить
Where do get your clipart?
Ответить
Hi, thank you for this explanation! To your knowledge, is it possible to include hyperlinks within this new card visual? So you can open URLs via the visual?
Thanks in advance =)

Beutiful video I was really stressing but you allowed me to complete this, and my boss loved it thank you
Ответить
incredible
Ответить
Really great video. Any tips on the sites where you get the icons from
Ответить
Great stuff. The svg part gets me wondering about all other possibilities with that feature...
Ответить
Good work. Nice video Park !
Ответить
Great video but please one quick question can you tell me about a website to download those images you made in the video for the card visual
Ответить
Hi, thanks for great video. Can you help me with my spraklines? I did everything as you, but I can't see a sprakline. It seems to be there, because a number of TotalSales is a litlle bit higher than others numbers, but still as if invisible. I have AdventureWorks2019 star schema database, so my dates are from DimDate, maybe this is a problem ?
Ответить
Hi thanks for the explanation. Don't we have any possibility to display targets and targetranges along with the specific values?
Ответить
Very nice! Thank you for sharing! Quick question, I noticed that you altered the sparkline measure by renaming all measures of "Sum Gross Sales" to "_sum sales" simaltaneously. Please explain how you do that all at once?
Ответить
Thanks for the video! However, I'm running into a problem wherein I am unable to change the data category of the measure I have created to Image URL. The only 2 active options are Postal code and bar code. How to solve the issue ?
Ответить
👌👌👌 informative video
Ответить
Nice tutorial. Won my LIKE and my subscription. Thank you for sharing !!!
Ответить
Thanks! It looks great.
Ответить
Really awesome. Thanks for the video!!.
I see that you have the "Build a visual" panel when you hover over a visual.
How do I enable that option? I'm trying to have it like that.

Thank you
Ответить
Please Don’t i tell me i need to be dependent on internet connection and other site + make a dax code to use some svg instead oglf just using timeline. It is absolutely not a user friendly stuff it should be much easier and not dependend to connection at the time
Ответить
That's amazing
Is the dataset available to download to play around with it?

Great video.
Ответить
how to apply filter on this visual on a particular card in new updated card
Ответить


