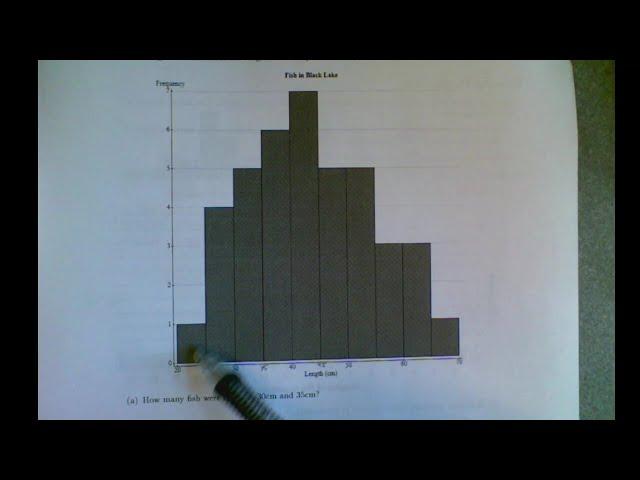
1.3 Visualizing Numerical Data with Histograms
VIDEO CHAPTERS
0:00 Introduction
0:52 Reading Histograms, Example 1 (ungrouped data)
6:36 Reading Histograms, Example 2 (grouped data)
11:20 Classes for Numerical Distributions
22:22 Creating Histograms in Excel
32:24 Displaying Empty Classes in Excel
43:46 The Shape of a Histogram
48:43 Example 8 (commenting on the shape of distributions)
Комментарии:
1.3 Visualizing Numerical Data with Histograms
David Heywood
Давидыч - Вся Правда про BMW M5 #shorts
Auto World
MOTOR BEKAS 150CC HARGA MULAI 5 JUTAAN !
Angga Jonathan
TOP 20 RED HOT CHILI PEPPERS RIFFS (with TAB)
Nikola Gugoski
Memasang Datepicker di Laravel + AdminLte
Asikcoding
IMMO OFF MAGNETI MARELLI 4MV.XX VOLKSWAGEN SEAT SKODA AUDI
Car programming
Moog Grandmother | Sound Demo & Overview | Thomann
Thomann's Guitars & Basses
За кошти "Бюджету участі" в Івано-Франківську ремонтують освітні заклади
Телерадіокомпанія ВЕЖА


