Tutorial: Real Time Data Visualization - d3, crossfilter, websockets in Python by Example
Learn how to do this with my tutorial :
https://medium.com/@benjaminmbrown/real-time-data-visualization-with-d3-crossfilter-and-websockets-in-python-tutorial-dba5255e7f0e
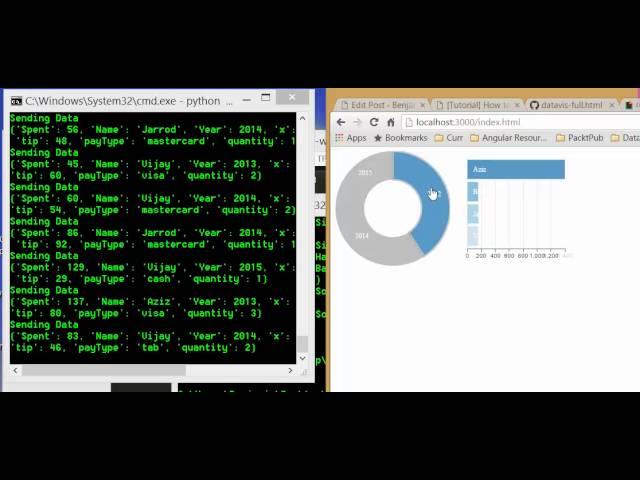
This is a quick video showing and example of real-time data visualization using websocket server publishing data along with the client side view created with d3.js, crossfilter.js, and dc.js.
Тэги:
#websockets #data_visualization #dataviz #data_viz #d3 #d3.js #crossfilter.js #crossfilter #dc.js #real-timeКомментарии:

L S - 29.06.2021 12:52
Hiya, really enjoyed the tutorial - do you have any advice on deploying this to a live server? I was able to run this locally but I'd like to have a live page that I could access from different computers!
Ответить
River - 16.03.2021 01:33
Hi Benjamin. Thanks for the read/tutorial. Quick question, Was there a particular reason you chose JS on the client-side instead of using something like Python's Bokeh? I'll be looking into both d3/crossfilter/dc and bokeh for my project but first wanted to pick your brain a bit to see if there were any performance concerns, or any other concerns that may have swayed you towards those particular technologies.
Ответить
Tutorial: Real Time Data Visualization - d3, crossfilter, websockets in Python by Example
Benjamin Michael Brown
USA vs China vs Japan - Country Comparison
Dastatistics
Lazadia - So Hi
Lazadia
Is Stop Motion Studio Pro worth 5 dollars?
Learning Curve Tech
французская барахолка | сокровища прошлых веков
Одесситка в Швейцарии
Venom Getting Swatted | Venom (2018)
Scene City

