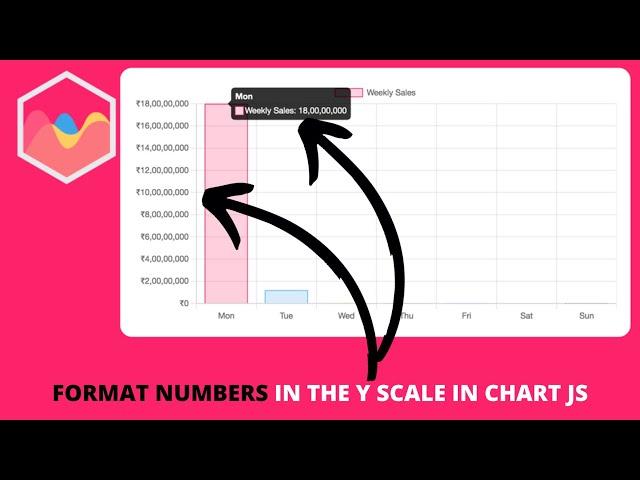
How to Format Numbers in the Y Scale in Chart js
Комментарии:

Thanks for sharing, I have used it to solve my issue.
Ответить
Great videos, thanks for the effort you put in! How can you change the date format to the appropriate country when the X axis displays the date and time?
Ответить
Hi! What would the code look like in Brazilian format? Example: R$ 1.500,00
I tried like this.. but it didn't generate the graph. : (
locale: 'pt-BR',
ticks: {
callback: (value,index,values) => {
return new Intl.NumberFormat('pt-BR',{
style: 'currency',
currency: 'BRL',
minimumFractionDigits: 2
}).format(value));
}
}
How to leave it in this format? R$ 1.500,00

Thanks Bro, Your Videos are veri helpful and very good. is it possible to customize our price value from 1000 to 1K , 10000 to 10K and 1000000 to 1 M?
Ответить
Thanks so much! Your videos are so helpful and "save my life" ! Congrats man!
Ответить
thank you verry much
Ответить
These videos are amazing! Thanks so much for these. Would it be possible to get a video on positioning tooltips to the center of a bar chart instead of the top?
Ответить
Wow, you make that function even better. 👍👍👍
Ответить


