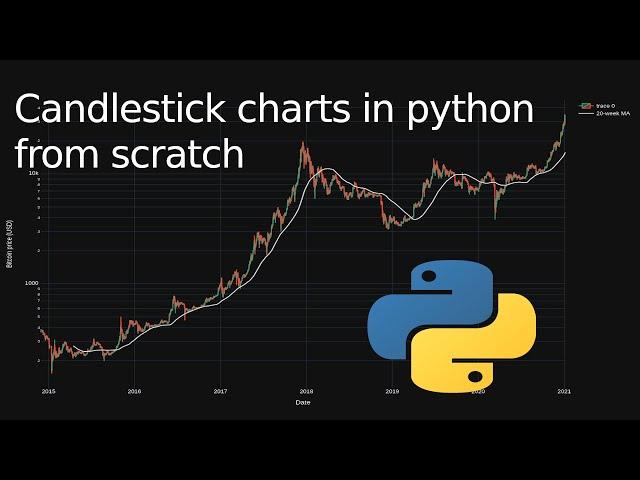
Candlestick charts in python from scratch with Plotly
Комментарии:

Hi Chad, have a nice day. I want to make something like this : Firstly I set an alert condition on tradingview. And when that is happened, I want to draw last 60 min chart with plotly. And send to my discord channel both of them. How can I do this or did you make something like that before 😊 Thank you
Ответить
hi chad thanks for all the vids first of all. Is there a simple way of dropping the gap in time that we have when the market closes ? i tried chart.update_xaxes(
rangeslider_visible=True,
rangebreaks=[dict(bounds=[16.59, 9.30], pattern="hour")]
)
but its not working perfectly, thanks alot

Could you show charting using tradingview library using local datafeed like CSV? Thanks
Ответить
I didn't have seen yet this video but I already have had an overview of 2h30 of the AlgoTrading For Beginners and I want to thank you a lot !!! Please , continue you work .
Ответить
Very Good. How to add and arrow to indicate an opened position in chart? Thanks!
Ответить
hi, is there a way to get live data through api? I want for a django project.
Ответить
how your graph is opened in new tab ? I am using google colab and graph is open in same page. pls help
Ответить
Awesome !!!!!!!!!!
can you please share your code or git link.

Hello teacher, when I try to import pandas it shows me this error "ModuleNotFoundError: No module named 'pandas'". Can you help me?
Ответить
It is Supergood !!! Thanks o lot!
Ответить
another great video! thanks for sharing!
Ответить
What if we want real time data from broker, and animate the candlestick as price updating ? Is it possible using plotly ? Thank you, great tutorial and subscribed!
Ответить
How would you add other indicator panes - for example if you wanted RSI below and MACD above?
Ответить
Hi, if I want to show 5m data then ...? What to do
Ответить
What is the second best time range?
Ответить
![В БОЛЬ? Выпуск №217 НЕУКЛЮЖИЙ ПРОФЕССОР Concept 5 на Утесе [Мир Танков] В БОЛЬ? Выпуск №217 НЕУКЛЮЖИЙ ПРОФЕССОР Concept 5 на Утесе [Мир Танков]](https://invideo.cc/img/upload/Y3UzOUVsVUtkUkE.jpg)




![[Free] Cloud Melodic Type Beat "MONDE" Instru Rap Trap Triste | Instrumental Mélodieuse [Free] Cloud Melodic Type Beat "MONDE" Instru Rap Trap Triste | Instrumental Mélodieuse](https://invideo.cc/img/upload/Yzk0d2d6M2JxWGU.jpg)

