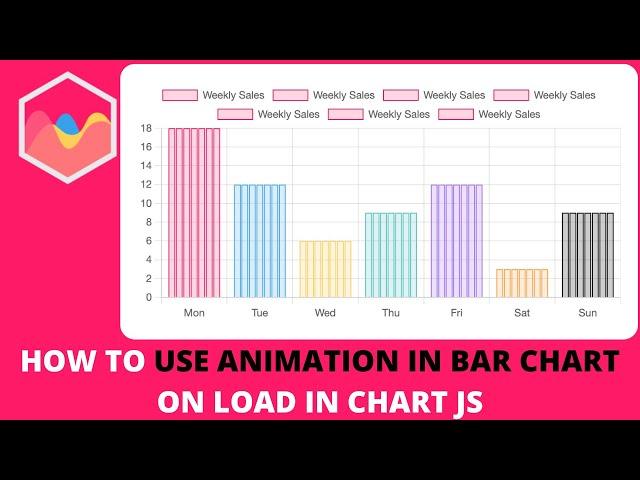
How to Use Animation in Bar Chart on Load in Chart JS
Комментарии:

Vũ Anh Nguyễn - 28.09.2022 13:09
I love your video, very clear, detail and to the point
Ответить
Layton Miller - 27.07.2022 03:20
I'm confused because I cant find a description of the difference between the options.animation and options.animations properties, and why they are different.
It probably doesn't help that I'm using ng2 charts which is an Angular wrapper for this library, which seems to do weird stuff to default values (i.e. breaks them) - but can you provide a description? I've read the source, the docs, the API docs, watched videos, etc. I've straight up copy/pasted entire configurations and had no animations at all.

Ruhullah Shaikh - 23.07.2022 13:35
please make a video on how to add and subtract data value, taking first dataset as a base value using dynamic textbox and button
Ответить
Welcome to the Next Major League
NLL | National Lacrosse League
Newcastle fans go CRAZY as they SMASH VILLA AGAIN!
Villa On Tour
Cargloss YR Hijab w/ Joyagh #shorts
Cargloss TV
It's Not FAIR: Earfun Air Pro 3 VS Airpods Pro 2
CEONTHEMAKING


![[FREE] ALEE X LYWIE TYPE BEAT ~ GIRASSOIS [FREE] ALEE X LYWIE TYPE BEAT ~ GIRASSOIS](https://invideo.cc/img/upload/OFpyWXIwTmZlck4.jpg)


