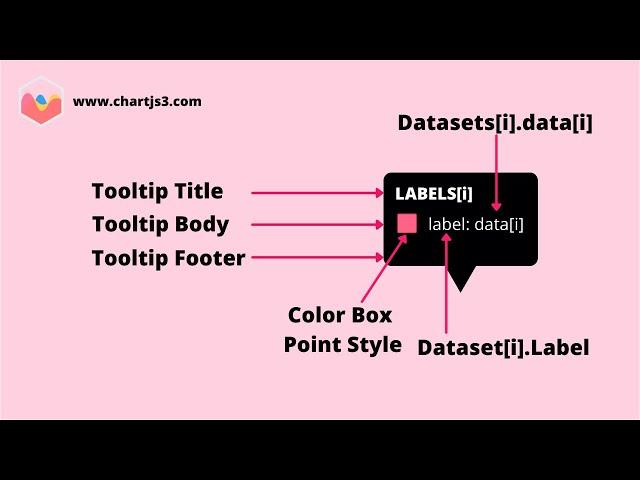
How to Add More Information in the Tooltips in Chart JS
Комментарии:

hi! How do I make only the label value bold?
Ответить
Can it be used with scatter plots? I'm facing issues when trying to incorporate tooltips alongside other plugins. The current setup looks like this:
plugins: [chartAreaBackground, quarterIndicator],
How can I include tooltips in this configuration, given that they should be structured like this:
plugins: {
tooltip: {
callbacks:{ ... }
}
}

I started with Chartjs using a simple chart, but as the project progressed, customer requests increased. Every time I was worried about how to do it, but you made a video and shared what I was looking for. Keep it up!
Ответить
Great video. Sorry if I missed it but I would like to be able to change the label within the body. I hope that is the correct terminology - basically the text after the coloured square. If I return 'text' with "label: function (context)" I can fix the value, in this case it returns 'text'. But if I refer to context[0].dataIndex I get "Cannot read properties of undefined (reading 'dataIndex')". I don't understand what I am doing wrong here? Maybe it's not possible to do what I want?
Ответить
Excellent video - really saved me a load of time. Many thanks.
Ответить
Thx! Just what i needed! ...you sound dutch. Klopt dat? :)
Ответить
HI i need ur help ,tooltip --> label: data[i], i need the symbol in near data[i], for eg: car: $900, is it posible
Ответить
hi, is the source code available for this example?
Ответить
How to use colorbox on title instead of label?
Ответить
Thank you so much!! Amazing explanation!!
Ответить
That's exactly what I was looking for!😥👍
Ответить
I looked for this for like 1-2 days. I wish I knew it was called tooltip but it is okay lol. Thank you so much for the video.
Ответить
is it possible to have different bar with different tooltip value like [bar red population 20, male 8, female 12], [bar blue population 24, male 14, female 10]? been stock with this problem for a couple of weeks now need help please thanks in advance!
Ответить
Hi! great tutorial. Can you help how to make it responsive on zooming in at 200%?
Ответить
very useful , thank you
Ответить
Hi great videos and very clearly and informative, i have learnt a lot from them. Thank you. I have a chart with two datasets stacked bars and want to show in the tooltips both datasets with the correct color bars too, can you show me how to do that please?
Ответить
Hi, How can we change the Square Box to a circle in the tooltip?
Ответить
Большое спасибо! Очень помогли
Ответить


