Комментарии:

Really great demonstrations here and well chosen examples.
Ответить
I don't like Seaborn, can't handle too much data on the pairplot
Ответить
Good comparison but what do you mean by saying matplotlib is more professional than plotly? I don't agree on that one and I'm a little confused what you mean by that. Plotly is very professional and has great support and community.
Ответить
👏👏👏👏👏👏
Ответить
So the conclusion is that big data uses M, otherwise it uses p, right?
Ответить
Jupyter notebook inside VS code is a best environment I think.
Ответить
Cool but why are the first 4 minutes a jupyter notebook and conda tutorial?
Ответить
HELP
Ответить
Jupyter lab is much better than Jupiter notebook.
Ответить
Wonder if there is any package that manages the Date format of the X-Axis professionally like the way typical stock chart does.
Ответить
Matplotlib is still the best for me
Ответить
It would be useful to have a guide on setting up Jupyter notebooks with different kernels. Python is easy to set up - other kernels have never worked for me.
Ответить
This looks almost the same as seaborn
Ответить
plotly is great, but for interactive media. this isn't as good when it comes to publishing static figures in journal articles/books, where seaborn just takes it to another level in terms of formatting and customizability.
Ответить
from my last hustles, it was not working on jupyerlab
Ответить
That's a really cool lib. Their makeup (blue, white lines) totally reminds me of seaborn
Ответить
I already saw that very jupyter notebook.
Why don't you add a link on it?

Thanks for the video, very informative!
Ответить
Who is this gapminder guy and why does he know so much about Europe?
Ответить
Well done! You deserved my subscription!
Ответить
Matplotlib is the only option when there's a lot of data to show. Plotly is often generating SVG charts, and it's very hard to render a very detailed chart composed out of SVG's only. Matplotlib creates raster images and unless you want it to be interactive, it's fine.
Ответить
Dumb question but why use or learn any code based platform for serious data visualisation when you can use industry standard dashboards like Tableau, honest question.
Ответить
Gosh, you spent so long waffling before saying anything about plotly.
Ответить
I do not recommend using anaconda. Why?: It does not provide a stable programming environment, differ from system to system. What I instead recommend is using the built in venv from python, which gives you more control over your programming environment. It requieres a bit more understanding of the system you are working in and reading more the documents of python, than the plug and play solution from anaconda, but you will earn a proper working transportable environment and a bit more background knowledge.
Ответить
Altair is worth looking at... super easy and powerful
Ответить
yes and no at the same time
Ответить
I see you doing ci' inside notebooks and can relate so much.
Ответить
For sure far better
Ответить
Wow, I’ve been using matplotlib for so long and never knew how easy plottly is. Guess I’ll try it out!
Ответить
👌👌👌
Ответить
Hello can you please do a video on Model training with ADNI 3D MRI dataset. i cant find anywhere. I am trying to train the .nii file but ADNI doesn't provide test dataset. Instead they provide train dataset and test csv. Please make a video on it. Please
Ответить
Whatever that takes longer than 15 minutes to put it to work, ain't a "top visualization tool".
Tried for first time yesterday, failed miserably to even try the demos...
Will return someday, for the time being is in the rubi 🗑️... I mean bucket list 🙂👍

awesome
Ответить
Currently starting development on a visualisation program. I think I'm going for plotly for the interactivity.
Ответить
Wow, so much japanese here, it's simply mindboggling.
Ответить
hätte nie gedacht das du aus österreich kommst :) machst gute videos 👍
Ответить
Is plotly the better matplotlib? Hell no
Ответить
I'm using anaconda and often matplotlib, I know something about plotly and seaborn and I would, I would like to use them more. This video encourages me to do it.
Ответить
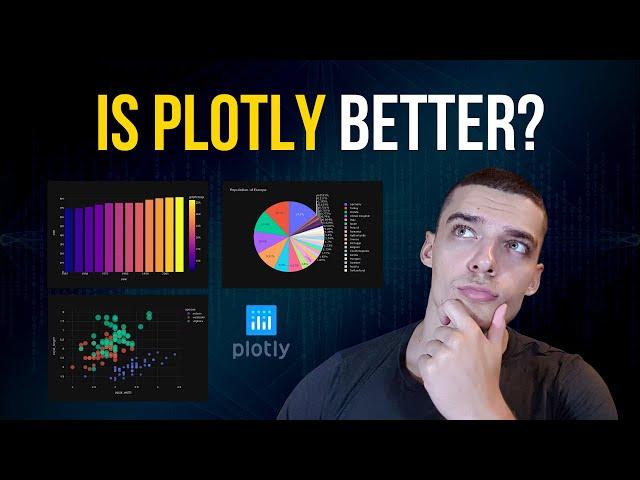
love the new clickbait style thumbnail... worked on me lol!
Ответить
Yes please do a video on the anaconda environment and why would use conda instead of pip.
Also you are an excellent teacher thank you.

Great video! Thanks!
Ответить
I'm trying use matplotlib in an ubuntu server machine.. is there any way that I can view the graphs in server machines?
Ответить
Hands on video, just what I need. Thanks man ;)
Ответить
aconda Tutorial would be a great idea
Ответить
Yes, it is.
Ответить
Florian, thanks for the contents! Every video is really interesting...
Ответить
Like ur thumbnail
Ответить


![[Kung Fu Movie]A Kung Fu master killed a Japanese colonel with one sword, no one could defeat him! [Kung Fu Movie]A Kung Fu master killed a Japanese colonel with one sword, no one could defeat him!](https://invideo.cc/img/upload/d3lUNTgzNVJta2Q.jpg)


