Комментарии:

Outstanding. Thank you.
Ответить
really love your explanantion! thank you so much for your video, really helpful and i can understand it! keep it up! looking forward to your many more upcoming videos
Ответить
really useful video thank you, I've just started my MSc project using PCA, so thank you for this. I will be following subsequent videos.
Ответить
thank you so much for this video. incredibly helpful.
Ответить
Great tutorial but it leaves me with the question, what do i do with it? Is this just the begining of a K means classification that gives me an idea of the proper k?
Ответить
Many thanks for your efforts to make this complex issue much easier for us. Could you enlight me to understand group similarly and dissimilarity using pca?
Ответить
How is it possible to generate outliers uniformly in the p-parallelotope defined by the
coordinate-wise maxima and minima of the ‘regular’ observations in R?

In fact I found out how to overcome the multicolinearity , by using the eigen values of PC1 and PC2! I love PCA!
Ответить
Thank you for this great video. can you show how to seek multicolinearity or treat multicolinearity with PCA ? I have a data set with 40 variables with high intercorrelation because of cross reactivity . VIF and matrix correlation doesnt work probably because of multiple comparison ....:(((
Ответить
Excellent walkthrough. Thank you!
Ответить
Added to my stats/math playlist! Very useful.
Ответить
please explain Scatterplot using DAPC also
Ответить
5 year old video still one of the best I found on the topic on YT. Thumbs up
Ответить
Amazing video! Thanks for the explaining everything very simply. Could you please do a video on PLS-DA?
Ответить
Thanks for the the video, it helped me a lot!! Your explanation is very didactic!
Ответить
Thanks much Hefin!!!
Ответить
How can I upload my data into RStudio to work with ?
Ответить
Can you run PCA on factor variables coded as 0 vs 1. 1 meaning presence of something?
Ответить
thank you very much
Ответить
Where did you define PC1 and PC2 (where you use them in the ggplot)? I'm getting "Error: object 'PC1' not found"
Ответить
Thank you so much for your videos!! Your videos are the best I have seen hands down :) All of your explanations and step by step through R are what I needed to work on my research.
One area I am having trouble with (since I am not a statistician) is making sure I run my data through all the necessary statistical tests before running the PCA. My data is similar to the iris dataset (skull measurements categorized by family and subfamily levels) but I am seeing different sources run different tests before the PCA (ANOVA vs non-parametric tests). If anything, would you be able to recommend some good sources for me to refer to? Thank you! I really appreciate it!

Thank you so so much!! You just saved the day and helped me really understand my homework for predictive analysis.
Ответить
Fantastic!
Ответить
Great teacher you are, thanks
Ответить
If you work this through with Palmer's Penguins it is great practice. An excellent tutorial.
Ответить
This tutorial is outstanding. Excellent explanation! Thank you very much!!!
Ответить
Hey Hefin, I wonder if you can also do a tutorial of PCA producing triplot graph?
Ответить
Thank you so much for the very clear and concise explanation!
Ответить
Thank you!
Ответить
Very helpful, thanks!
Ответить
The explanation is just perfect. Thank you.
Ответить
Error in svd(x, nu = 0, nv = k) : infinite or missing values in 'x'
???

Hi Hefin, can I put a percentage in the PCA 1 and PC2 in the x and y-axis? How to do that?
Ответить
If my biological data only has numbers(1,2 & 3 digits) and a lot of zeros, do I need to scale also?
Ответить
THANK YOU SO MUCH
Ответить
Hey Hefin,
Amazing video! I am working on my own PCA at the moment.
If at all possible would you be able to go over a few questions with me?
I would appreciate any advice you would be able to give.

this is a brilliant video! is it possible to plot PC1, PC2 and PC3 on the same graph at the end? I have tried this by altering the code but have not managed to get it.
Ответить
its so funny I don't think you realize but myPR "my pyaar" in Urdu/Hindi means my love. Thank you for an amazing and extremely helpful video
Ответить
Hi, i wonder if it's possible to put label in each points? I tried geom_text but i get error
Ответить
I never comments on videos, but you really saved me here. Nothing was working on my dataset and this came smoothly. Well done on the explanations too, everything as crystal clear.
Ответить
This is gold. I absolutely love you for this
Ответить
Very cool Hefin. I'm trying to run a data reduction for panel data (220 countries, about 25 years of data, and about 100 different variables). Could PCA be used for this?
Ответить
Thank you Hefin Rhys for explaining PCA in detail. Can you please explain how to find weights of a variable by PCA for making a composite index? Is it rotation values that are for PC1, PC2, etc.? For example, if I have (I=w1*X+w2*Y+w3*Z) then how to find w1, w2, w3 by PCA.
Ответить
what is the pca package ?
Ответить
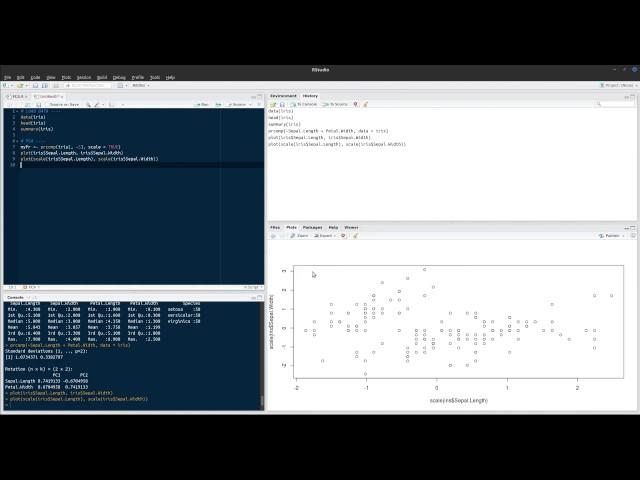
Can I confess something that baffles me? Because, I see this all the time. OK, so you, personally, are motivated to share your knowledge with the world, right? I mean, you took time, effort, energy, focus, planning, equipment, software, etc. to prepare this explanation and exercises. You screen-captured it, you set up your microphone, you edited the video, you did all this enormous amount of work. You're clearly motivated. Yet, when it actually comes time to deliver that instruction, you think it is 100% acceptable to place all your code into an absolutely miniscule fraction of the entire screen. Like, pretty-close to 96% of the screen is 'dead-space' from the perspective of the learner. The size of the typeface is miniscule (depending on your viewing system). It would be like producing a major blockbuster film, but then publishing it at the size of a postage stamp. Surely, it would be possible for you to 'zoom-into' that section of the IDE to show people what it was you were typing - the operators, the functions, the arugments, etc. I'm not really picking on you, individually, per se. I see this happen all the time with instructors of every stripe. I have this insane idea that instruction has much, much less to do with the insturctor's ability to demonstrate their knowledge to an uninformed person and has much, much more to do with the instructor's ability to 'meet' the student 'where' they are and to carry the student from a place of relative ignoracne (about a specific topic) to a place of relative competence. One of the best tools for assessing whether you're meeting that criteria is to PRETEND that you know nothing about the topic - then watch your own video (stripping-out all the assumptions you would automatically make about what is going on based on your existing knowledge). If you didn't have a 48" monitor and excellent eye-sight, would you be able to see what was being written? Like... why would you do that? If writing of the code IS NOT important - don't bother showing it. If writing of the code IS important, then make it (freaking) visible and legible. This really baffles me. I guess instructors are so "in-their-own-head" when they're delivering content, they don't take time to realize that no one can see what is happening. . It just baffles me how often I see this.
Ответить
Thanks for a great tutorial! Can a PCA analysis be applied to a DTM to distill the main themes in a corpus of documents?
Ответить
Thanks a lot for a great video. Could you possibly guide me to a source with info on performing cross validation in R after doing PCA on the data? Possibly as clear as yours:)
I've been searching and mostly came across guides on how it's performed after doing PLS-DA. I'm preparing a report for a modeling course and am asked to provide (describe and perform) a validation step.


