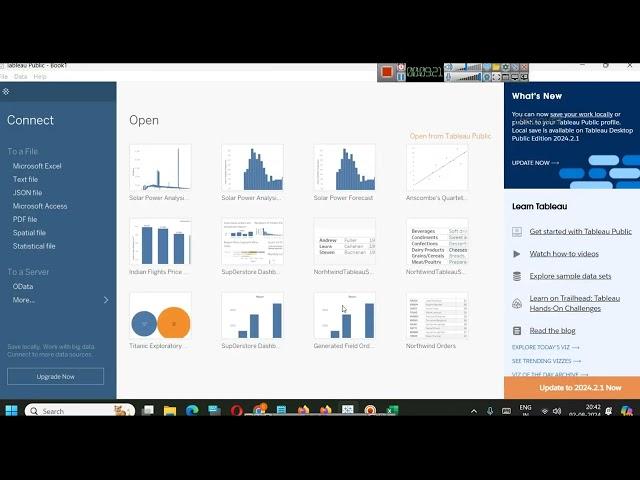
Data Analytics Class Day 4 - Line and Bar Graphs with Tableau - 3 August
#dataanalytics #tableau #industrialtraining #slidescope
This video starts with where we left off in the previous class 3
Follow Us:
https://facebook.com/slidescope
https://instagram.com/slidescope
https://twitter.com/slidescope
https://slidescope.com
This video starts with where we left off in the previous class 3
Follow Us:
https://facebook.com/slidescope
https://instagram.com/slidescope
https://twitter.com/slidescope
https://slidescope.com
Комментарии:
Data Analytics Class Day 4 - Line and Bar Graphs with Tableau - 3 August
Colorstech Training (By Slidescope)
PAW Patrol Big Truck Pups | Colors For Kids
Games Patrol
How to Mute & Unmute Someone in Facebook Story
Moon Tutorials
Husqvarna X-CUT™ - typy łańcucha
HusqvarnaPolska
A lot of Action on The Street - Home Construction Project #homeproject #homebuilding #vanislehomes
Lalonde Property Group | Victoria BC
【ハイライト】 HOME 仙台89ERS戦 GAME1 2024/4/6
島根スサノオマジック


