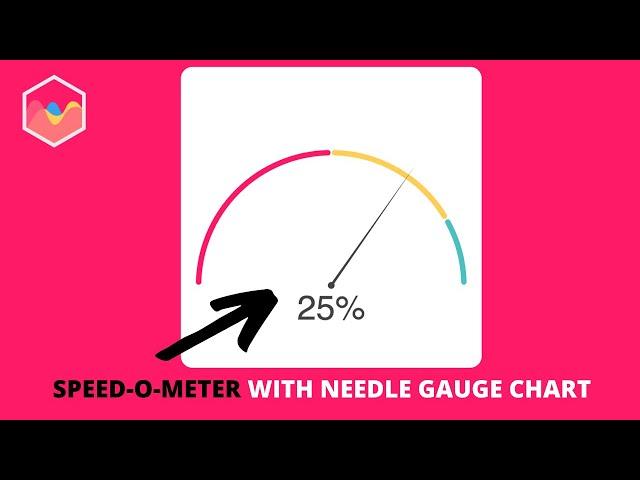
How to create a Speed-O-Meter with Needle Gauge Chart in Chart.js
Комментарии:

Very good video, helped a lot. For the length of the pointer I've found a different solution. This is a circumference so we know that the radius has the same length in any point of it. With that we can say the radius is the width divided by 2. For me is working very well in most situations.
Ответить
i can't get _metasets property in chart context, pls help me?
Ответить
Awesome tutorial!!!! Is it possible to add a second needle on the chart with a different value? (e.g. one for current speed and one for average speed). Thank you very much!
Ответить
Thank you for the demo sample,im like for this for ages
Ответить
thankyou for the tutorial, but do you know how to make the needle move smoothly from one value to another value?
Ответить
Great Video! Really helped me out.
// Equation to make the needle length dymamic for responsive design website
const needleLength = width - chart._metasets[0].data[0].y/2;

is there a Github with the finished code?
Ответить
Hi Sir, how about the same example in react js?
Ответить
great video, can help me, i need a create a similar component but i require to the gauge to move with touch mode.
its possible?

your videos are very helpful. the most comprehensive tutorial sofar on charts js out there. Thank you!
Ответить
why you don't add source code, bro? You could save a lot of time who doing it himself repeating after you
Ответить
Thank you so much sir
Ответить
Great tutorial!
Is there any way you can animate the needle when you update the dataset? So it moves smoothly?
Thanks in advance

What's the best video to watch to learn how to add scale labels to the speedometer?
Ответить
I have my guage settings as "circumference: 120; rotation: 300", needle length is perfect at center, smaller at edges. How can i solve this.
Ответить
hi, tux for the content, super videos you got !!
just can you explain how we can animate the needle from start of chart to needle value ??

can you give tutorial for react js i really confused thanks
Ответить
thank you sir,
can show how to add one more needle in speed o meter chart

Also how would one restructure the base code for require JS
Ответить
Thank you for a very informative, detailed video, brilliantly done. Has the second video for adding in labels around the gauge been done? Thank you.
Ответить
Is it possible to somehow use the circumference option for a polar chart?
Ответить
How to make a gradient color in a Gauge Chart?
Ответить
I want to do the same thing with chartjs 2.9.4 and also I need to show it as a gradient color. Do you have any tutorial or video for that? Your help will be much appreciated, Thank you.
Ответить
small recommendation. For the length of the pointer.
Instead of using
ctx.lineTo(height - (ctx.canvas.offsetTop + 10), 0);
use this instead.
ctx.lineTo(chart._metasets[0].data[0].outerRadius, 0);
The pointer will always end at the top end of the gauge

Hello, all your videos are excellent. As soon as I add ctx.rotate(angle); and refresh the entire canvas rotates many times and ends up on an odd angle, the needle does not move. is it something simple? I'll continue to check my code I copied from your video.
Ответить
This is really helpful. I have a couple of requirements that I can't figure out. Hope you can help me out.
1. Is it possible to remove the space at the top?
2. How can I add the data labels in the arcs of the speedometer?
Thanks in advance!

Hi, both needle dot and needle do not appear. Do you know why that happens? I followed the code to the letter. Thanks for helping
Ответить
Hi Sir, Can we get the source code for speedo meter needle gauge chart in chartjs version- 3.6.0 which is coded in the above video by you?
Ответить
Hi, can you show an example on how to create a linear gauge chart?
Ответить
sir, i exactly tried you code but guageNeedle plugin not showing any data in console, i will drop you a mail please help me out
Ответить
Thank you for this! It's exactly what i needed, i've been trying to wrap my head around a project that needs something like this and i just didn't get it. This is very well explained. I'd love to see a video where you create charts that refresh with API requests so we can display real time data
Ответить

