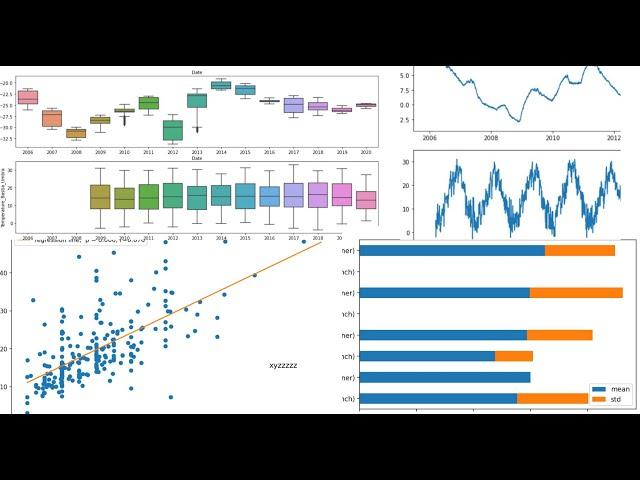
Data visualization with python | Create and customize plots using Matplotlib, seaborn and pandas
Комментарии:

how we load other dataset in seaborn from different dataset????can any one explain
Ответить
I dont get the datasrt
Ответить
Thanks, sir very useful for social survey-based research. I have conducted a questionnaire-based research where I have selected more than 300 households, more than 30 questions, each question contain the level of vulnerability, like, low, medium, high, and very high. kindly give tips to analyze my data.
Ответить
Great video on visualization so far
Ответить
Hi,
Please can you provide me the correct link that its include the data set "tips", The link in the description dont contains the data.

Thank you so much Sir. can you make a video on plotting hurricane tracks using seaborne or matplotlib?
Ответить
Well explanation and very good channel
Ответить
Plz share data set link and jupiter note book codes link for practice
Ответить
Thanks
Ответить


