Комментарии:

I felt like I learnt one new good thing today. Thank you sir
Ответить
Can we automate or conditional format the color arrow dependent on excel cube if minus than red if plus then green?
Ответить
Can you post a link to the file?
Ответить
Thanks bro
Ответить
error occured in excel when i follow you formula in diff + diff - and data label + datablabel -
i think it has something with my excel version.

thank you for this trick, it really helped me with my thesis!
Ответить
This is good, but have one query, if add more months then data is not expending and gives some errors
Ответить
yo this is fire!
Ответить
Very nice. Very useful. I need a help. How to represent the well depth and groundwater level in the well below ground level?? Any idea?
Ответить
idk if your growth rate formula is right. shouldn't it be year 2 - year 1 over year 1? so 2021 - 2020 / 2020?
Ответить
This is very helpful in identifying trends and visualizing where gaps and wins are for KPIs. Nice !!!
Ответить
amazing! What a legend!
Ответить
Lovely from 2023. Thank you.
Ответить
Awesome video
Thanks

How to do the same if I have to include another year in the data?
Ответить
How do you do this using a pivot table expressing % Change?
Ответить
Tq sir
Ответить
This is great learning. But why did we choose diff+ for 2020 error bars and diff - for 2021?
Ответить
very good! 엄청나군요.
Ответить
Thank you, love it❤
Ответить
would you please share with me the excel file with regards?
Ответить
Hey, this is amazing tutorial, but is it possible to do this for more than 2 years, because I am assuming this approach for months, is there a way that I could just keep adding months and see the change?
Ответить
lmao i was tNice tutorialnking the sa but don't give up! We got tNice tutorials!
Ответить
Great! Thank You
Ответить
Beautiful chart, thank you
Ответить
the best from thailand
Ответить
You have beautiful imagination, sir !
Thank you so much !

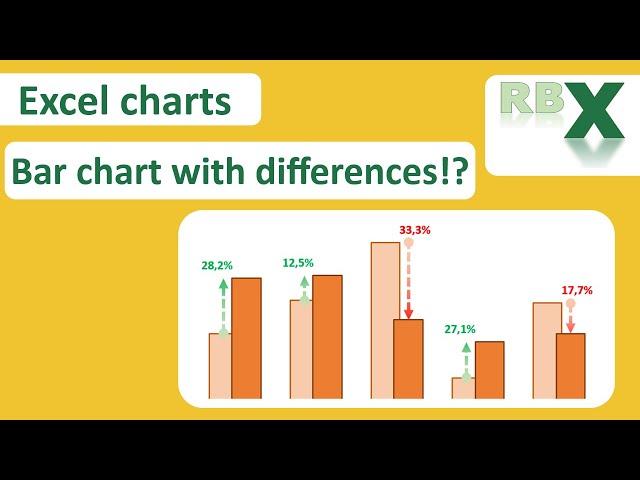
Great technique for the charts; thank you. Just one observation, I think the % calculations for the two columns are the wrong way round? Eg Feb increase by 90 on a basis of 630 in 2020 should show a 14.3% increase not 12.5% (which is based on the 720).
Ответить
Great video Sir
Please provide exercise file also. Thank You

Thank you sir great information for excel user
Ответить
excellent, great information plus a beautiful graphic, thank you
Ответить
Greit!!! Thank You. Expecting for more videos!
Ответить


![[FREE] MAC DEMARCO x BOY PABLO TYPE BEAT *BY UR SIDE* [FREE] MAC DEMARCO x BOY PABLO TYPE BEAT *BY UR SIDE*](https://invideo.cc/img/upload/SWsxT0o5ZWlEWks.jpg)


