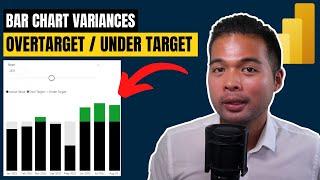
VISUALISE variance in Bar Charts // Show Over Target or Under Target // Beginners Guide to Power BI
Комментарии:

Cool video. I've changed around the target values to be last years values for my use case. Works fine thanks
Ответить
I want to do the same for margin percentages but its not happening for me it 3 values don't show up as clear as yours. and the percentage also has to be calculated its not in a column as i used a measure earlier
Ответить
pls check, keep getting error
Over Target =
VAR _Headcount=Sum(Headcount[Actuals]
Returns
If (_Headcount > Targgggt[Targgggt Value]), _Headcount -Targgggt[Targgggt Value]

i have 2 dates to compare using bars & its not working
Ответить
please comment on this. it's not working for me. than you.
Over Target =
Var DATEFst=SUM(DATEFst[Fst HODate])
if(DATEFstFst [HODate]>DATETargt[],DATEFst[Fst HODate]-DATETargt[Targ HODat])

thank you very helpful!
Ответить
can we do this to show growth difference?
Ответить
Thanks!
Ответить
Hey Fernan. Great video, as per usual. Can you please add timestamps to your videos? Thanks!
Ответить
Great 👍
Ответить
Thank you! Great technique for a visual that gives the user even more useful information at a glance!
Ответить

![Flag of Australia Waving [FREE USE] Flag of Australia Waving [FREE USE]](https://invideo.cc/img/upload/b0xjOU5HZDBRek0.jpg)


