Комментарии:

@pushkarjoshi4005 - 02.06.2023 18:30
This is stunning and thanks a lot for an easy explanation. I just have one question, if i create 3D bar charts, can I click and filter the rest of the visuals in my dashboard ? I am curious as it seems to be a collection of data points and not a single block.
Ответить
@kharisheee - 23.11.2022 18:05
Firstly thanks for such a clear and crisp explanation. I am not getting idea how to use this for larger data set can you please help me.
Ответить
@kamikachauhan8609 - 22.03.2022 04:54
Waow for explaining in such easy steps
Ответить
@prashantj.t7492 - 21.07.2021 10:51
Cool. Thank you
Ответить
@TeluguTraveller1 - 06.07.2021 20:19
It looks amazing and Can i get the link to download those shapes?
Ответить
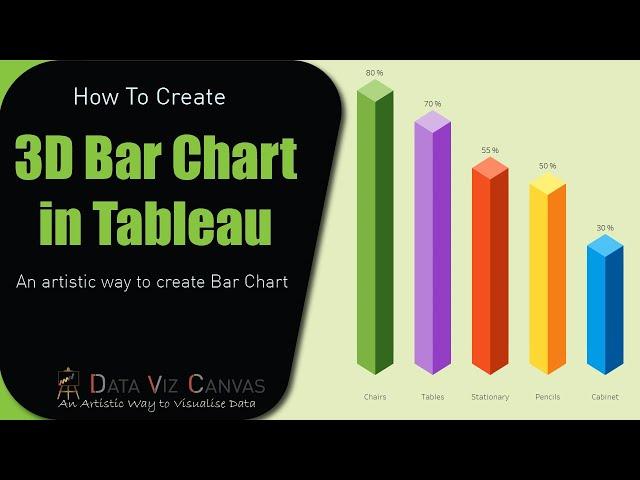
Create 3D bar chart in Tableau
Data Viz Canvas
[TẬP 582] Chuyện Ma Có Thật : CĂN NHÀ MA VÀ BÀ CHỦ NHÀ QUÁI ÁC
Chuyện Ma Vũ Mập
Kunleng News Dec 20th, 2024.
VOA Tibetan
МУБАШШИР АҲМАД ДОМЛАНИ ГАПЛАРИГА МУНОСАБАТ | Аброр Мухтор Алий #dolzarb_mavzu #abrormuxtoraliy
Abror Muxtor Ali ™ | Suhbatlar

![[TẬP 582] Chuyện Ma Có Thật : CĂN NHÀ MA VÀ BÀ CHỦ NHÀ QUÁI ÁC [TẬP 582] Chuyện Ma Có Thật : CĂN NHÀ MA VÀ BÀ CHỦ NHÀ QUÁI ÁC](https://invideo.cc/img/upload/VVlBWW1Ib3dndzA.jpg)

