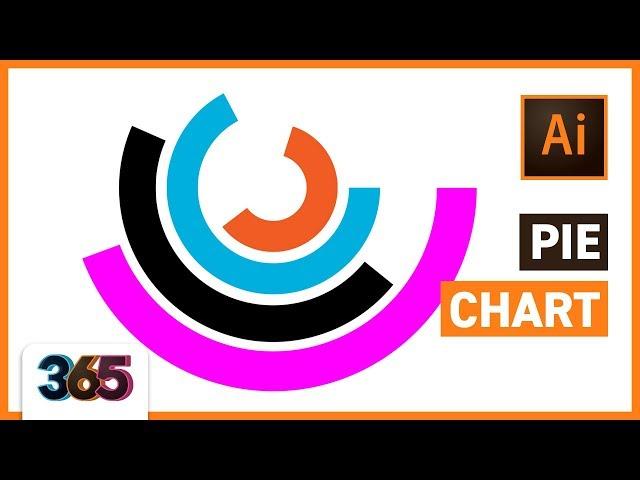
Pie Chart | Illustrator CC Tutorial #233/365
Understanding the process in today's tutorial will come in really handy for creating infographics, symbols, icons and simple illustrations in Illustrator CC 2018. Martin will demonstrate a useful and easy to pick up workflow which uses opacity masks.
It's important that assets like infographics are both visually accurate and also interesting! Which is a hard mixture to crack. This technique could save you loads of time on future projects and ensure you always produce precise and professional results.
Remember to check back tomorrow! If you miss a few days don’t worry, keep an eye on our playlist to find monthly roundups of our 365 tutorials.
LEARN FROM US:
Build Rock Solid Foundations with our New 12 Weeks long Graphic Design Starter Bootcamp:
https://yesimadesigner.com/courses/starter-bootcamp/
SUPPORT US
https://www.patreon.com/yesimadesigner
BUY OUR DESIGN BUNDLES
https://gumroad.com/yes_im_a_designer
READ OUR BLOG
http://www.yesimadesigner.com/
FOLLOW US
https://www.instagram.com/yes_im_a_designer/
Тэги:
#Illustrator_Infographic_tutorial #pie_chart_illustrator_tutorial #creating_infographics_in_illustrator #infographic #tutorial #creating_infographics_with_illustrator #simple_illustrations #simple_illustrations_styles #simple_illustrations_tutorial #opacity_masks_illustrator #illustrator_cc_techniques #vector_graphic_adobe #vector_graphic_adobe_illustrator #365_days_of_creativityКомментарии:
Pie Chart | Illustrator CC Tutorial #233/365
Yes I'm a Designer
Arif Babayev/Şur dəstgahı
KONS TV
ALEX TERRIBLE DIE ANTWOORD I FINK U FREEKY COVER
Alex Terrible
While My Guitar Gently Weeps Jam | Guitar Backing Track (A Minor)
Now YOU Shred Backing / Jam Tracks
MEDICAL CHECK-UP FOR EMPLOYEES IN FINLAND | Filipino in Finland
Andy´s Diary 22
Praveen Jain, Juniper Networks | Juniper Networks AI-Native NOW
SiliconANGLE theCUBE


