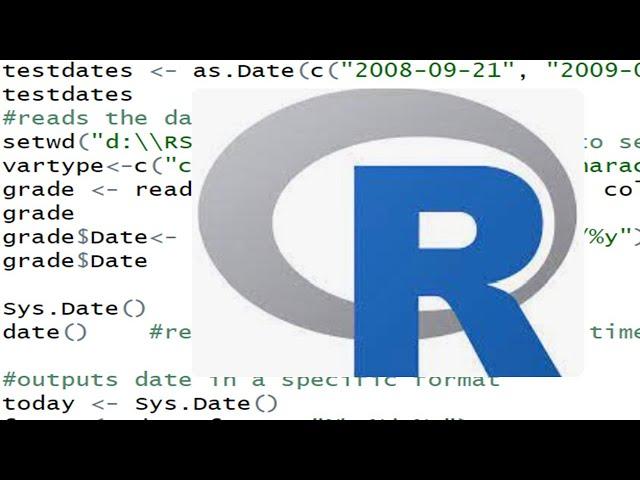
R programming data visualization with ggplot2 part 55
This video is part 55 of R programming full tutorials. And more focus of this video is placed on ggplot2 package in R.
----- Contents of this video --------------------------------
00:00 - Intro
00:57 - Start building a graph
02:23 - Add Geoms in ggplot()
08:32 - Using Grouping
11:32 - Using Scales
13:49 - Using Facets
15:57 - Formulate Labels
17:18 - Formulate Themes
18:08 - Graphs as objects
20:14 - Saving graphs
21:22 - Bar charts
26:01 - Histograms
29:17 - Box plots
37:08 - Kernel density plots
42:09 - Violin Plots
46:20 - Scatter plots
50:50 - Dot plots
58:15 - Stem and Leaf Plots
1:01:55 - Tree maps
#rstudio
#rprogramming
#ggplot2
#rstats
#dataframe
#rdatacode
Тэги:
#rstudio #rprogramming #rstats #datascience #ggplotКомментарии:
Mongraal Abuses 500 FPS & 0 Ping in Solo Cash Cup
Galaxy Clips
GEGER!!! Pemotor Trail Mesum Sentuh Area Sensitif Gadis Desa Berkemben, Temannya Asik Merekam
Tribun Pekanbaru Official
NeurotechEU - in vivo optogenetics
NeurotechEU
нексюша, гречка - Весна
нексюша

![3D Roller Coaster 05 VR Videos 3D SBS [Google Cardboard VR Experience] VR Box Virtual Reality Video 3D Roller Coaster 05 VR Videos 3D SBS [Google Cardboard VR Experience] VR Box Virtual Reality Video](https://invideo.cc/img/upload/NGE2NnpGRmdRS2s.jpg)


![[SUB] 해외 입양 후 노숙자가 된 쌍둥이 자매! ‘워싱턴 거리에는 쌍둥이 자매가 있다’ (2/3) #SBS스페셜 #SBSspecial #SBSstory [SUB] 해외 입양 후 노숙자가 된 쌍둥이 자매! ‘워싱턴 거리에는 쌍둥이 자매가 있다’ (2/3) #SBS스페셜 #SBSspecial #SBSstory](https://invideo.cc/img/upload/SVN5T3hfQ2ZLcW0.jpg)
