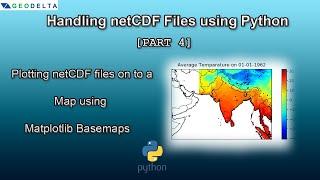
How to Plot netCDF data onto a Map using Python (with Matplotlib Basemap toolkit) (Part 4)
Комментарии:

sir , how we plot netcdf file using shapefile with python . when we have a sape file
Ответить
Excellent, thank you :)
Ответить
The best explanation! Thanks much.
Ответить
EXCELLENT tutorials! THANKS!!!
Ответить
how do I solve this error "MemoryError: Unable to allocate 1.99 TiB for an array with shape (523600, 523600) and data type float64"
Ответить
This tutorials seems great for a beginner like me. Do you have any ideas regarding merging multiple netCDF files into one for a given time scale (daily, monthly, yearly, etc.) using Python ? Thanks.
Ответить
Hello! I encountered a problem saying
ModuleNotFoundError: No module named 'netCDF4.'
How to solve this?

You're a good teacher
Ответить
When I am running the line for c_scheme map is being displayed but when I am running the last line for colorbar then I am getting blank box. Kindly help
Ответить
I am not able to install this in the geo_env. Please let me know if there is any way.
Ответить
do you have a version for Mac who file
Ответить
Thanks for this. I will have to look for a conversion to Cartopy instead of BaseMap and follow most of your instructions.
Ответить
Great video! I am using macOS and am having trouble installing the Basemap add-on. There doesn’t seem to be any Mac files to download on the website you link, and I can’t find any online either. Is there another way for me to install? Thanks
Ответить
Ohhh thanks a lot Sir, tired of it before. Basemap successfully installed in my device.
Ответить
If you have dust data, and you wanna see if there is dust in a country a specific day, how can you see that without making a map?
Ответить
Hello there I am working with NECTDF data the problem I have is my Lat and Lon are all 3 Dimensional, SO when I try to do a map it gives me an error, how can I resolve this?
Ответить
C:\Users\Sairam>pip install C:\Basemap\basemap-1.2.2-pp38-pypy38_pp73-win_amd64.whl
ERROR: basemap-1.2.2-pp38-pypy38_pp73-win_amd64.whl is not a supported wheel on this platform.
(base) C:\Users\Sairam>pip install C:\Basemap\pyproj-3.3.0-pp38-pypy38_pp73-win_amd64.whl
ERROR: pyproj-3.3.0-pp38-pypy38_pp73-win_amd64.whl is not a supported wheel on this platform.

Hello, I would like to ask how to draw cumulative variables instead of an average of one per day in the film?
Ответить
wow...! your voice is so attracting....
Ответить
Sorry, but when I try to download basemap in your link it downloads a Python Wheel format and not a .whl document. What can I do?
Ответить
Hey very interested and useful one.
What is the upper and lower latitude & longitude for worldwide.

Hey I am unable to do the pip install for basemap package, it gives me the "not supported wheel" error
Ответить
Very relevant and brilliant explanation. "Kite" recommendation was a life saver. Wondering if I could reach out for some advice .Thank you so much.
Ответить
Thank you very much for making this tutorial video. I appreciate it a great deal.
Greetings from Berlin!

sir please tell me how to install mpl_toolkits.basemap in spyder. i have installed all other libraries like numpy, netCDF4 and matplotlib but mpl_toolkits.basemap cant be installed. i have installed all these libraries through anaconda environment, i have searched there mpl_toolkits.basemap library in anaconda search but it is not present there and all other 3 libraries are there which i installed.
Ответить
It works properly and perfectly for me. Thanks ~~
Ответить
hello
cannot import name 'dedent' from 'matplotlib.cbook' (C:\Users\hp\anaconda3\lib\site-packages\matplotlib\cbook\__init__.py)
m getting this error plese help

Thank you for this tutorial. You teach so well.
Ответить
I have this problem "No module named 'netCDF4'" can someone help me
Ответить
Thank you! You saved my academic life!
Ответить
Great video! Do you know how to create a colored map from a formula that calculates a value from latitude and longitude?
Ответить
Hi, new to python and following your tutorial. this line - c_scheme = mp.pcolor(x,y,np.squeeze(tp[0,:,:]), cmap='jet') is giving the following and the map is blank
c_scheme = mp.pcolor(x,y,np.squeeze(tp[0,:,:]), cmap='jet')
<ipython-input-52-438aca6114c4>:1: MatplotlibDeprecationWarning: shading='flat' when X and Y have the same dimensions as C is deprecated since 3.3. Either specify the corners of the quadrilaterals with X and Y, or pass shading='auto', 'nearest' or 'gouraud', or set rcParams['pcolor.shading']. This will become an error two minor releases later.
c_scheme = mp.pcolor(x,y,np.squeeze(tp[0,:,:]), cmap='jet')
Any help with this?

How can I install basemap in linuxmint?
Ответить
Well done, bro, thanks for your sharing
Ответить
Bro, make this same video but with cartopy
Ответить
Sir, i downloaded min temp data of india from 1960 to 2019 of every day and every hour in one netcdf file. Now i want to extract min temp from 24 hours with its date and store it in variable. How to do it..please help
Ответить
when i run the code i have " No module named 'netCDF4" at the beginning , what should i do? can someone help please
Ответить
Thank you very much for explaining so simply and nicely....I have just started to learn Python and your videos are very helpful.
Ответить
thats it, thanks a lot
Ответить
how to used a different shapefile for example shapefile of catchment area
Ответить
Thank you. When I run the code, I have 3 error:
1. No name 'Dataset' in module 'netCDF4'
2. Unable to import 'mpl.toolkits.basemap'
3. Module 'netCDF4' has no 'Dataset' member
My code is:
from netCDF4 import Dataset
import numpy as np
import matplotlib.pyplot as plt
from mpl.toolkits.basemap import Basemap
Could you help me?

Excellent Tutorial. Thank you!! It is something which I was looking for many days. Thank you again.
Ответить
Why am i getting this error?
Dimensions of C (240, 242) are incompatible with X (240) and/or Y (110); see help(pcolor)

My plot shows no color scheme even though I included one. Am I missing something?
Ответить
You are awesome. thank you so much.
Ответить
I can't install the basemap packages
Ответить
I had a problem when drawing the map, half of the map (nort,south america) wasnt drawn, this is the solution i found:
lons[lons>180]-=360


