Комментарии:

thank you, you nailed it, to the point Vedic
Ответить
thank you so much i was so confused what was difference between the michaelis-Menten vs Lineweaver-Burk chart was
Ответить
As an idiot i can understand without any problem 😂,incredible!!!thank you so much
Ответить
Thank youuuuuu
Ответить
❤😊😂
Ответить
Quick and excellent explanation. Thank you!
Ответить
Awesome explanation. Thank you veeeery much 🙏🏿
Ответить
so helpful! I’m an italian med student
Ответить
Was really helpful.thanks 😊
Ответить
THIS video makes it all clear! THANK YOU!
Ответить
IF we invert the equation.
Can vmax and km should be inverted to plot in the graph. Graph calculator is more than a convenience 🧮

Thanks🙏
Ответить
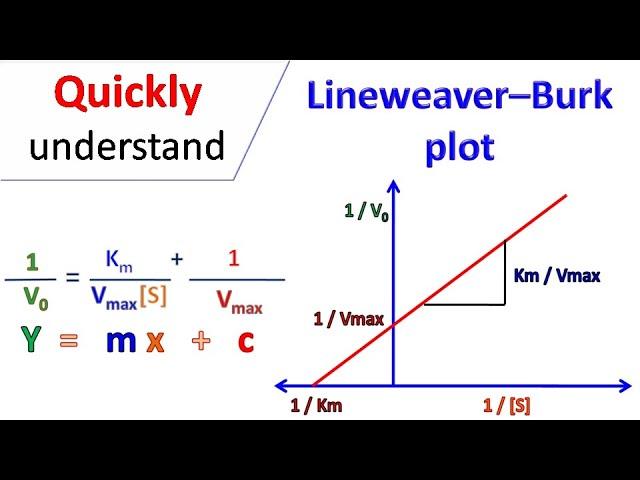
Thank you! the mathematics explanation helped explained how Vmax and Km value changes can be infered from the Line - weever. I guess thats the point of it, make it simple to see changes.
Ответить
Ty
Ответить
Just maybe I’ll make it through biochemistry
Ответить
Are you a man or a woman??
Ответить
🙏
Ответить
outstanding
Ответить
Excellent
Ответить
Thanku
Ответить
I remember watching this in university and I never forgot how helpful it was. Now 4 years later, I'm coming back to it in medical school <3
Ответить
ThankYou.
Ответить
I thought it's very hard
But seeing this video clear all the doubts thank you ❤️

How -1/km is come on negative side of x axis
Ответить
Explained to perfection !
Ответить
Plz
-1/km
From where coming???

awesome channel!
Ответить
This is a certified hood classic
Ответить
You are probably going save my exams today
Ответить
Thank you from 🇮🇳
Ответить
You are not telling about what is meant by these values and how it changes with substrate concentration so its very hard for me to understsnd
Ответить
Sometimes the easiest math seem difficult @ 2 o clock at night. Thanks for making it clear!
Ответить
sef razjasnu
Ответить
the only video that i understood thanks alot 😭🙏
Ответить
Thank you so much ,I understand it
Ответить
Thank you!! It really helped!!!
Ответить
Thankyou easy to understand
Ответить
Very very Thankful to you. Jazakallahu Khair🤲.
Ответить
awesome, thank you!!
Ответить
god this was soo easy thank you sm
Ответить
Weemax
Ответить
thank you very much. Understood!!!!!
Ответить
Fantastic video!!
Thank you so much 😉

This would help in my presentation ! ✌️
Ответить
What values on the plot are Vmax and what value is Km?
Ответить
Great stuff
Ответить
But on X axis why do we take - 1/Km ?
Ответить
Simply superb
Ответить
Thank you so much for making it that simple for understanding in a better way
Ответить
watching video after getting all lineweaver burke questions wrong
"hence, lineweaver burke plot is one of the easiest graphs to understand enzyme inhibition"


![Slendrina Family Transformation [Stick Nodes] Slendrina Family Transformation [Stick Nodes]](https://invideo.cc/img/upload/QWd4cjh0c1cxZTA.jpg)


