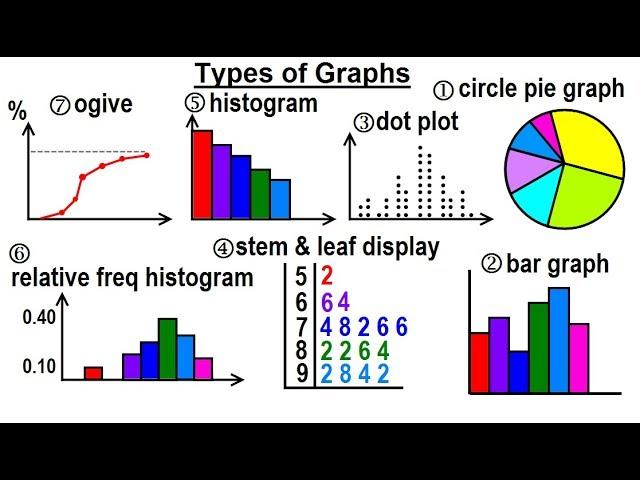
Statistics: Ch 2 Graphical Representation of Data (1 of 62) Types of Graphs
Комментарии:

Good
Ответить
Hello what's the best data presentation for survey questionnaire to present their answer in every questions. My problem is that every questions there are also sub questions.
Ответить
Thanks
Ответить
Sri Lakshmi Manasa Dharanikota
PHD English
Sem1
Jvr2142
Session:Theory:2.1
Subject:Quantitative techniques
21.09.21

i was learning how to calculate capacitance in this channel a while ago, and it helped me a lot, today i searched for "how to better represent data", this gentlemen showed up again, i click on it absolutely without any hesitation and with this familiar voice, i learn things again, respect.
Ответить
Very good and useful explanation in a short video. Thank you!
Ответить
Very creative teaching sir
Ответить
Uncle how are you ?
Ответить
Thanks
Ответить
I need Channel 4 Probability and Channel 5 Probability Distributions of this Playlist Statistics...
Ответить
When Will the other channels of this playlist will be uploaded...
Ответить
Welcome to electroline🤔
Ответить


