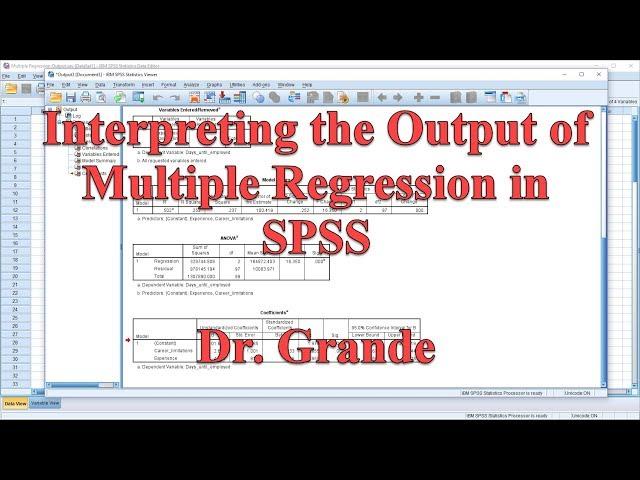
Interpreting Output for Multiple Regression in SPSS
Комментарии:

can i have your e-mail
Ответить
Thanks! This helped!
Ответить
Dear Dr. Thank you
Ответить
Dr. Todd u save my degree
Ответить
Thank you😊
Ответить
thank you!
Ответить
Thank you where can we get the dataset for this?
Ответить
Thank you lady 😊 helps lots
Ответить
Do you use JASP at all? If so please upload some videos.
Output explained are the most valuable vids! Are you able to show annoted outputs at all or APA write ups for reports?

How come you tubers explain it better than my actual teacher?
Ответить
Sir..
Can you give a example how to write this result in journal paper?

Hey does anyone know how to state least squares estimate of model using spss and explain each terms in model
Ответить
How can we transform the sub-items of variables into one item for regression?
Ответить
Thank you for the insight😃 Dr Grande
Ответить
You made me 99% more confident after watching your video. Thank you.
Ответить
so like t column is just a ration of unstandardized coef, so when interpret it is not very important as the other column?
Ответить
Would you the constant value too or is that not interesting to discuss?
Ответить
Thank you, this is great
Ответить
So which of the independent variables is a stronger predictor of the dependent variable ? Do we report the negative which has higher Std. coefficients or we report the positive one because it is positive ?
Ответить
How to interpret a significant negative beta when the alternative hypothesis is positive? Thank you...
Ответить
Thank you!
Ответить
I need help with the interpretation of my multiple regression results; is there any way we can reach you. please.
Ответить
this is great sir. Thank you
Ответить
OH MY GOD! I WATCH YOUR PSYCHOLOGICAL ANALYSES YOU POST NOW!! FULL CIRCLEEEE
Ответить
Dear Dr. Grande thank for the helpful video. But I have a question in the interpretation of Career limitation that is the 95% confidence interval includes the null hypothesis of no difference" 1" please elaborate it
Thank you !!

What does the R2 mean?
Ответить
Thanks a lot for this video. I am a PhD candidate who have used you video to analyse your data
Ответить
This man out here single handedly saving my degree
Ответить
Excellent
Ответить
how would you report the statistical equation for this output?
Ответить
The explanation look good thanks a lot
Ответить
Actually very helpful. Keep it up
Ответить
Very helpful! Answered all my questions! Thank you so much! ❤️
Ответить
Very informative, thank you.
Ответить
You made easy for me to understand. Thank you!
Ответить
Thank you for clarifying the doubts. Kindly help me in understanding how to run multiple regression analysis (hierarchical stepwise) with 2 predictors and 3 criterion/outcome variables
Ответить
Thank you Dr. Todd <3
Ответить
There was a lot of multiple regression in spss videos. but this is the only video that explains this clearly. this helped me a lot. thank you so much. I really appreciate it.
Ответить
Thank you so much for this lecture one more thing I want to ask that is it necessary for all predicted values to have same units??
I mean if two independent variables have same units as the dependent variable but one independent variable have different unit then can we perform the multiple regression analysis??

Thanks, just want to know if possible to make a video on how to interpret the coefficient table of the longitidunal studies. I mean a predictor at Time 2.
Ответить
THANK YOU
Ответить
Very well explained, thank you so much! I deeply appreciate your videos.
Ответить
Hi, thanks for your video. I've seen elsewhere that you should report the F value and the associated degrees of freedom. What do these signify in relation to the regression model?
Ответить
How exact can I predict the days when I know the limitations and experience of a person? An outcome of 88,345 days would be to exact I would think, because of the standard errors. How would I make this prediction?
Ответить
hand to read the table result
Ответить
Clear explanation, helped me a lot for my master's dissertation, thanks!
Ответить
Thank you for all of your video, really helpful, i have a question , in my analysis the constant is not significant but some variable are ,so what does it mean?
Ответить
So helpful, thanks
Ответить
Thank you. Sir can u please upload a video on survival analysis (kaplan meir and Cox regression)
Ответить


![[FREE] Country Type Beat x Zach Bryan "On The Backroads" [FREE] Country Type Beat x Zach Bryan "On The Backroads"](https://invideo.cc/img/upload/VWs0bFozS05Iano.jpg)


