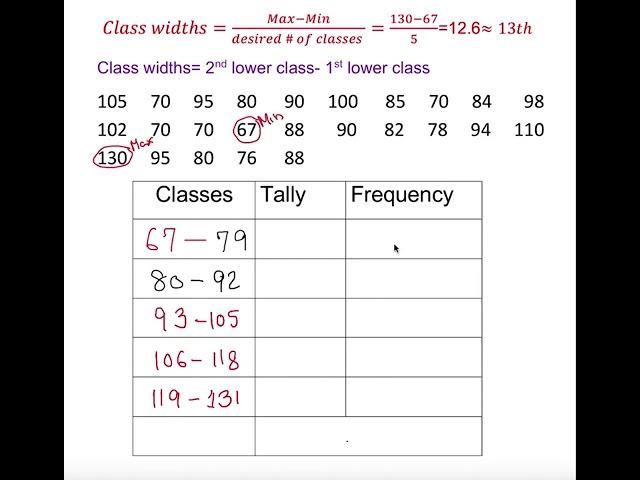
Grouped Frequency Distribution Table from a Data set
Комментарии:

@bettymelvin - 20.10.2023 16:06
voice is too low
Ответить
@animethighs9966 - 02.09.2023 10:02
Can anyone explain how he went from 80 to 92 when he added 13? How’s that possible?
Ответить
@umasri4038 - 26.08.2023 09:27
Voice is not clear at all
Ответить
@yestodream - 01.05.2023 17:19
Thank u much that's really helpful
Can u do for us how to draw a chart ?
I have a problem with the numbers in the frequency line sometimes I don't know if I start with 2 or 1 or other numbers

@dhanapara2856 - 23.04.2023 18:45
Thanks a lot sir💪💪💪💪💪💪💪💪
Ответить
@luseprophete9778 - 20.01.2023 10:30
Thank you! Very clear explanation.
Ответить
@reabetsweserepo9699 - 13.11.2022 11:41
Thank you,you explained it very clearly
Ответить
@marinamarikar3684 - 21.09.2022 12:10
Very clear explanation. I was struggling. Thank you Sir
Ответить
@onion3910 - 07.06.2022 15:30
What if they did not ask any classes?
Ответить
@zahidsediqi245 - 07.06.2022 12:04
thank you
Ответить
@syntaxerror2409 - 10.04.2022 18:11
this helps a lot, thanks
Ответить
@dkc199 - 05.03.2022 14:05
Rrb ntpc one has asked on frequency
Ответить
@soumika8110 - 30.04.2021 14:19
Thank you so much for your explaination
Ответить
@taqwamohammad1650 - 21.10.2020 10:42
not nad
Ответить
Grouped Frequency Distribution Table from a Data set
MK Learningcenter
All Problem Fixed 2nr App 2021
R Technical Indian
producer italiani VS producer americani
Icona Boi
100 CRAZY & EPIC Insane Motorcycle Crashes Moments | Best Of The Week
SWAG Lab - Motorcycle Crashes
AI hunters are improving…
Kyleong makes
Spider-Man 3 - Symbiote Hand Pull [4K FULLSCREEN]
SymbioteSprite
Empire total war PUA Пруссия - Великий Король #3
Adytum Games
Everdream Valley - Let's Play Ep 1
hodge podge


![Spider-Man 3 - Symbiote Hand Pull [4K FULLSCREEN] Spider-Man 3 - Symbiote Hand Pull [4K FULLSCREEN]](https://invideo.cc/img/upload/VVNyRlVSSFQxYkw.jpg)


