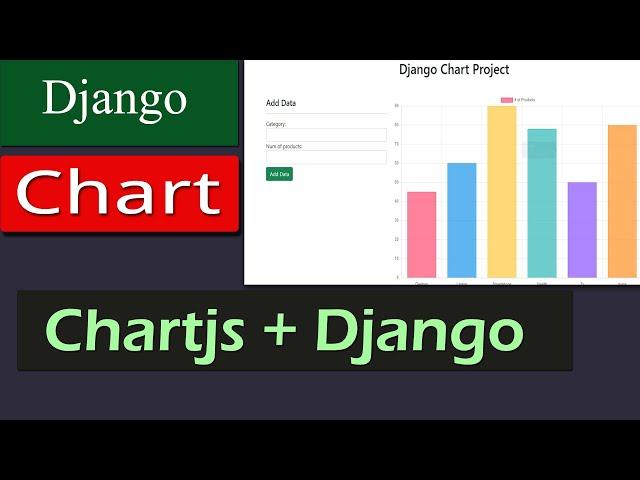
Django + Chart + Database Integration || Add Data Using Forms And Get Dynamic Chart Easily!
Комментарии:

Ur no
Ответить
Thank You So Much !!!
Ответить
Awesome tutorial!!
Ответить
Good work
Ответить
In which database you made this
Ответить
Hi....The video is great. But now my requirement is to display two bar graph on same page then how can I do? Please reply
Ответить
how to draw target line on bar chart ?
Ответить
Thanks so much!
Ответить
Awesome. Thanks very much
Ответить
👍👍👍👍👍
Ответить
When i am trying to add a product is iPhone -20 no of product it shows in one line
Again i will create iPhone -50 no of product it shows again in the graph
It doesn't update ...it goes another line ...

Great job! Thank you
Ответить
I appreciate your efforts.kindly connect highcharts with postgres db
Ответить
Really useful! Thanks for sharing!
Ответить
great job !! , also I want to know how I can do if I have my database in Mysql
Ответить
how to solve this problems '[{% for product in products %} '{{data.month}}' {% endfor %}],' it shows error.
Ответить
Great job, this was really useful. Next time would be cool if you did a vid showing how we could use the x axis as a date field that dynamically updated when you added an entry on that date.
Ответить
Hi, Can I plot pandas pivot graph with chartjs, I have date, person, percentage sell of products with product name. I have plot pivot graph, How can I do this?
Ответить
great job, can you share the source code, please?
Ответить


