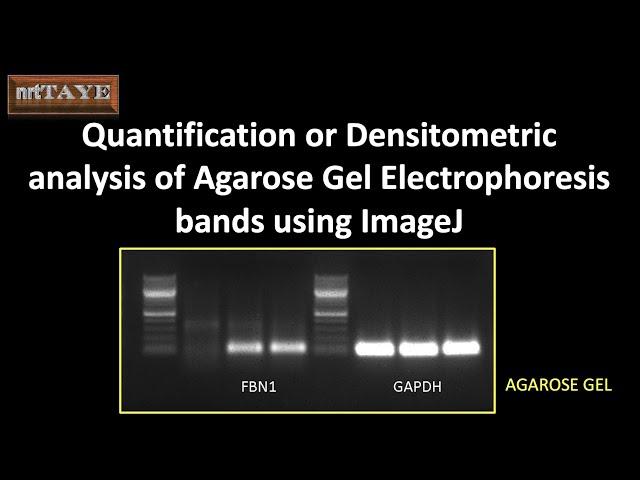
Quantification or densitometric analysis of agarose gel electrophoresis bands using ImageJ
Комментарии:

How did you manage to make the image of the comet so clear?
Ответить
Can u do this to analyze spots in a TLC?
Ответить
Thankyou.. anyway what unit do you use for each number of the results of the gene expression quantification?
Ответить
Why are we dividing it with gapdh instead of subtracting? Also, how to compare the results of untreated and treated cells when GAPDH value varies. please reply
Ответить
Hi there, I was wondering if it is possible to calculate the fluorescence quantity absorbed from SDS-PAGE gels? My goal is to create a graph that represents the Molecular weight of the band on the x-axis and the volume of fluorescence detected along the y-axis.
Thanks.

Me salvaste hoy jajaja ❤
Ответить
I'm not able to copy the jpeg image into this software
Ответить
Good information 👍👍
Ответить
Thank you!!
Ответить

