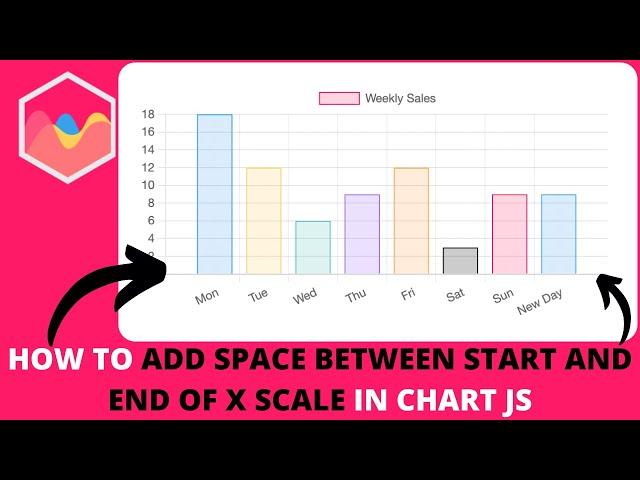
How to Add Space Between Start and End of X Scale in Chart JS
Комментарии:

your videos are terrible
Ответить
Hi, any way to add those spaces without data.labels or adding null value part?
Ответить
How to add html code for axis lable?
Ответить
How could you make it so that in a single index there is two groups of bars, with one bar overlapping the other bar. You have shown in a few videos how to do it with only two bars, but can you do it for 4? Thanks
Ответить
Hi!
Is it possible to implement a crosshair tool to get the values from a line chart at any point, if y axis is logarithmic? A lot of scientific data is better represented as y = log(f(x))

Your videos have been helping me a lot with a personal project. Just wanted to ask if it is possible for the points of a line graph to "stick" to one specific bar in a grouped bar chart? (Instead of the point always in the center)
Ответить
![[Free] Dark Loop Kit / Sample Pack 2020 - "Trapped" (808 Mafia, CuBeatz, Pvlace, Frank Dukes) [Free] Dark Loop Kit / Sample Pack 2020 - "Trapped" (808 Mafia, CuBeatz, Pvlace, Frank Dukes)](https://invideo.cc/img/upload/TWhaSTNQMzM5NUg.jpg)


