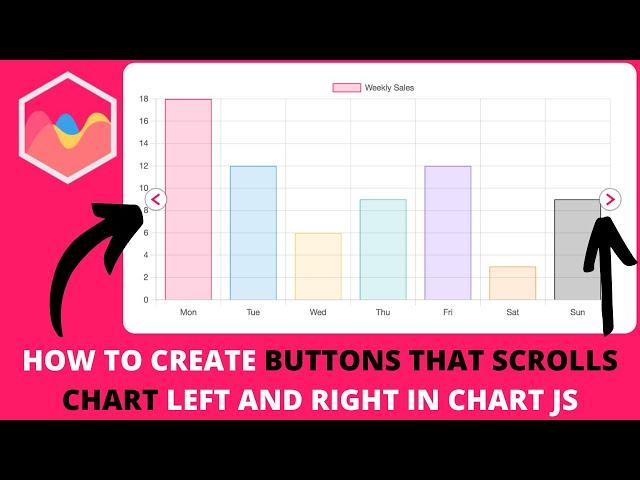
How to Create Buttons That Scrolls Chart Left and Right in Chart JS
Комментарии:

Basically what I am doing rn is drawing three gantt chart set
Ответить
this is great, thank you very much!
but where to add the moveScroll function if we are using React.js ?

is it possible, when 0 to 6 index then left arrow hide and same right last index (hide, show)
Ответить
How I can do this in react js
please help

Just outstanding! Can't stop watching your videos. Thank you very much!
Ответить
Can you please help me create this same functionality for the lower version of chart.js (2.9.4)?
Ответить
Please help. When scrolling a matrix chart, because the scale is chart area is drawn after the scales. The chartArea covers the scale.
Ответить
When I resize my browser the Scroll stops... You have some fix for this?
Ответить
If clicking chartArea gives you 0 values you can do the following:
create 4 variables above all the code:
let right_changing = null;
let left_changing = null;
let changing_height = null;
let changing_top = null;
Then inside " canvas.addEventListener('mousemove', (event) => { "
You put this:
changing_right = right;
left_changing = left;
changing_height = height;
changing_top = top;
Then in the moveScroll() function you simply swap:
right by right_changing
left by left_changing
I guess this is not the best way to solve that problem but it worked for me.

helllo, is there a source code for drawing the arrows ? thanks
Ответить
How can I do this in React?
Ответить
Hi can I enquire if there are many differences when developing in React using the React-Chartjs2 library?
Ответить
Thank you! That was an amazing tutorial. But I can't get it to work with dates.
Ответить
Finally... I did it... Thanks. Now continue to part 2
Ответить
Hello,is there any resource is about scrolling in ReactJS?
Ответить
last part movescroll not working in angular any idea how to do that
Ответить
Amazing tutorial, but my tooltip values slowly response.
Ответить
This is the most knowledgable video i was looking for, the best of the best but still scroll part is remianing but the concept of showing data by pieces is clear to me now
Ответить
Amazing content! I'm currently trying to replicate the BMI chart for kids and it is way more complicated compareed to adult bmi chart. How can I make the kids BMI chart showing the health status (such as underweight, healthy, overweight, obese) regions and then create a line graph of a childs BMI over the regions? Thank you again for this amazing work!
Ответить


![[FREE] Future Type Beat 2016 - "No Competition" | (Prod. By @1YungMurk) [FREE] Future Type Beat 2016 - "No Competition" | (Prod. By @1YungMurk)](https://invideo.cc/img/upload/QTZ0WWVjY0RNUXA.jpg)


