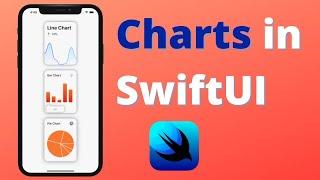
Create Charts in SwiftUI (Line, Bar, Pie) - Xcode 12, Swift 5, 2020 iOS Development
Комментарии:

the problem i found about this library is you cannot change the size of the charts. If you want to, you have to manually change it in the library which is not practical. it seems the library is intended for watchOS, you may use it with the large form size for iphones but not on larger devices.
Ответить
is there a way to change the color of the markers of the y-axis? Like for your linechart the values are 22, 16.75, 11.5, 6.25, 1. If i wanted that text to be white to pop out more, or even bold if possible, how would I go about doing that? Or do I just have to make an overlay?
Ответить
Boo dependency :(
I'm sure the video is helpful, but I can't bring a random library into this corporate app I'm working on, so I'm sad. Subscribed anyway!

I'm not sure why you still use UIkit
Ответить
Good stuff. You should do more SwiftUI content
Ответить
The chart view app does not have an associated project file. I checked in the repo, and didn’t see one. Where can I get a project file?
Ответить
Doesn't work on iOS 15 🙃
Ответить
how to make background dark for pie chart with the system dark mode..?
Ответить
What if your deployment target is lower than ios13? how do you import swiftuicharts?
Ответить
How can we add Axis labels and legends with this package?
Ответить
Great video! How does one set the Y-axis labels? And how about a secondary Y axis?
Ответить
This tutorial should be called how to use SwiftUICharts to DISPLAY charts... naive people like me could think you were going to show us how to actually CREATE a chart
Ответить
Cool
Ответить
Total useless library, does not provide full charts but only small widgets without any legends
Ответить
does this work with UIkit and storyboard?
Ответить
Awesome content! Could you dive deeper into that? Like how do you edit the grid? How do you make more data to be shown or less data (basically magnifying or reducing the view)?
Ответить
Is there any way I could implement these Charts in my project that comes with a storyboard? Love your videos!
Ответить
Great content!!!
Ответить
Currently the best channel to learn ios dev 👍🏽
Ответить
keep the swiftui coming! much much easier than swift 5!
Ответить
Great stuff bro
Ответить
Are your parents from England? I keep hearing you say but' on instead of button. Thanks for posting.
Ответить
This is looks great and very useful, thank you
Ответить
hey where can I contact you ? I need some answers and I can pay u :) thanks
Ответить
Thanks very much for developing this and for taking the time to explain how to use it. I have tested it in some work I’m doing and it has performed flawlessly. Some observations for a possible update: Could the uparrow symbol and rate value (like 14) be optional on both the line chart view and multi line chart view? Is it possible to add x-axis values and perhaps x-axis gridlines? The tooltip in a line view would perhaps benefit from displaying x-axis values as you move along the curve since the y-axis already displays values. Showing both x and y would be even better. Thanks again for developing this.
Ответить
great content . that is what I am talking about . SwiftUI content . " Keep it running " Creed from the office
Ответить
Thanks, more SwiftUI
Ответить
thank you your videos are incredibly helpful! keep it up :)
Ответить


