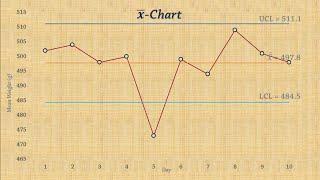
Statistical Process Control | Chart for Means (x-bar chart)
Комментарии:

Thank you very much. I scanned my textbook for hours trying to figure out these calculations and the way you explained was much more clear and allowed me to move forward. Looks like other commenters have experienced the same.
Ответить
You are to construct an x-bar chart such that the control limits would include 97% of the sample means, where the random samples would be of size 5; this it say that type I error would occur with 3% probability. The process standard deviation is known to be 3.2. The following data is used to construct the control chart.
You are to calculate the UCL only. Round your answer to TWO places of decimal.
Sample # obs 1 obs 2 obs 3 obs 4 obs 5
1 17 16 17 10 17
2 16 17 15 10 20
3 13 20 11 12 20
4 18 18 12 20 18
5 17 15 15 10 15
can you please solve this?

Thank you boss!
Ответить
man you saved my mba
Ответить
reaaallllyyyy helpfullll
Ответить
Thanks
Ответить
can i use control chart to controling sales or order performance from customer? which control chart should I use?
Ответить
very helpful and straightforward! thank you
Ответить
You were born for this 👏👏👏
Ответить
amazing explanation, he cut the long story Short and Simple.
Lee it up man.
❤

Your tutorial is amazing, clear and easy to follow, thanks alot
Ответить
Thank you so much
Ответить
❤️
Ответить
you saved me less then two hours before my final exam thank you sir may allah reward you jannah
Ответить
Thank you
Ответить
OY MY GHAD. I SWEAR MATHEMATICS IS FASCINATING BUT OVERWHELMING AT THE SAME TIME. THANK U FOR THIS!!!!
Ответить
I seen many videos,but I couldn't not understand now it was clear for my exams Thank you................
Ответить
I feel like crying🥺😩 the way my lecture made this simple stuff complex and his videos depressed me, I had to go through the confusing textbook searching for this. Thank you so much so these videos.
Ответить
I just love how brief these videos are even as the information is high quality.
Ответить
I have referred my classmates to your channel. You are amazing at explaining
Ответить
Since I knew your channel it has been my best learning center but I have lacked cusum charts sir, kindly find time to do a lesson on that.
Ответить
Just super again
Ответить
Excellent presentation, thank you
Ответить
Tq
Ответить
I am currently taking an operations and analysis class for my MBA, and the class confused me because the coursework was awful. This video was so helpful! Thank you.
Ответить
God bo as you bro
Ответить
very well explained.❤
Ответить
Thank you for this. Less than 4 mins and I grasp the concept
Ответить
YOU ARE A LIFE SAVER !
Ответить
Sorry pls I'm not still clear with how you get the Control constant
Ответить
Thank you 🙏 😭
Ответить
Tq sirr ❤
Ответить
Good definition sir
Ответить
Man you are the CEO of control charts, thank you so much
Ответить
Best
Ответить
Hello. It takes some time, sampling and processing to get to those UCL, LCL and mean value. So when you come to this situation like data point 5 is out of control then normally one cannot go on just like that but must consider what to do with this outlier and what to do with the limits...
When (condition) and how (procedure of recalculation) to reset the new upper&lower control limits. Is there a video or clear procedure for available ?

Brilliant.
Ответить
Great work, but I am not a Maths genius , how did yuo arrive at the figure of UCL = 23.1??? I am getting a figure of 497.80+ 0.577 = 498. 37 multiplied by 23.10 = 11,512.50 ---Can some one please explain ???? How did he arrive at 511.10 for UCL???? Thanks and kind regards...
Ответить
Awesome explanation, still valid and simplified.. thank you.
Ответить
why did we use A2 and not A3? how to determine?
Ответить
I am excited! Thank you!
Ответить
Quality content
Ответить
Super bro fantastic explanation
Ответить
Thank youuuu❤
Ответить
Why you took value on n as 5 from table
Ответить
You should take value of A2 from N=10 not from N=5
Ответить
Thanks for sharing this useful video
Ответить
Excellent and crisp explanation
Ответить
What if sample size is uneven.
Ответить


![[FREE] hyperpop dariacore 2024 drum kit [FREE] hyperpop dariacore 2024 drum kit](https://invideo.cc/img/upload/WVBPSjJrbjZzWDQ.jpg)


