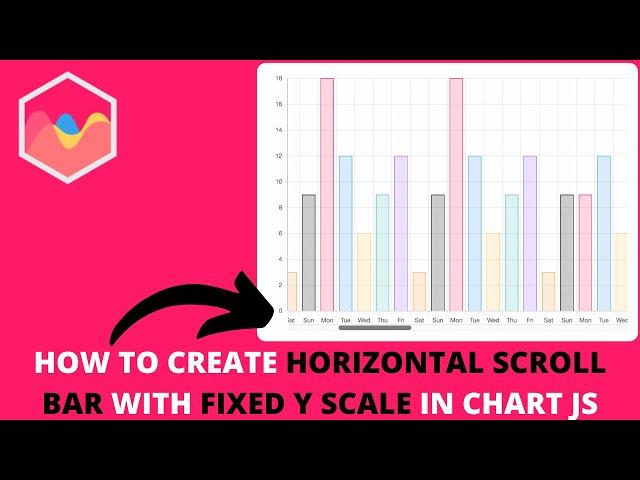
How to Create Horizontal Scroll Bar with Fixed Y Scale in Chart JS
In this video we will explore how to create horizontal scroll bar with fixed y scale in chart js. In Chart.js creating a scroll bar is tricky. With some CSS we can achieve something. However, if we need a fixed Y Scale we need to do a lot more.
The approach to get a fixed Y scale while scrolling requires more out of the box approach.
Let's explore how to do this.
▬ Chartjs Source Code ▬▬▬▬▬▬▬▬▬▬
Get source code: https://www.patreon.com/chartjs
▬ Chartjs Viewers Question Series ▬▬▬▬▬▬▬▬▬▬
This is part of the Chartjs Viewers Question series. Where we answer viewer questions. This question was asked by one of our viewers.
▬ Materials/References ▬▬▬▬▬▬▬▬▬▬
To keep the video short we might expect you to know parts. These parts we have explained in other videos. You can find the references here below:
Understand setup, config and render init blocks: https://youtu.be/pFuibt5HNog
Starting Code: https://www.chartjs3.com/docs/chart/getting-started/
Understanding Object Destructuring in Chart JS: https://youtu.be/_ZxfcJaSyuI
Understanding ChartArea in Chart JS: https://youtu.be/NgCHY3RVhEY
▬ Got a Question? Comment! ▬▬▬▬▬▬▬▬▬▬
Got a question or special request about a specific item? Comment below and tell me your question. I will make sure to follow up on you!
▬ Find Me Here ▬▬▬▬▬▬▬▬▬▬
Blog: https://www.chartjs3.com/chart-js-blog/
Website: https://www.chartjs3.com
Udemy Course: https://www.udemy.com/course/chart-js/?referralCode=56B57F673E9D41FF4AD2
Chart JS tutorials for Beginners:
🎓 Beginners Serie: https://www.youtube.com/watch?v=W6ai7wu5VIk
Chart JS tutorials for Intermediate:
👁️ Most Watched Chart JS Video: https://www.youtube.com/watch?v=4jfcxxTT8H0
⭐ Personal Favorite Chart JS Video: https://www.youtube.com/watch?v=PuFYW1yHzl4
Chart JS Dashboard Series:
👍 Most Liked Video Series:
Watch Part 1: https://youtu.be/l3MnVpiHXBU
Watch Part 2: https://youtu.be/fDUo-LbrRSo
Watch Part 3: https://youtu.be/xlt5dDa8rz4
▬ About Us ▬▬▬▬▬▬▬▬▬▬▬▬
Why we created these #chartjs and #javascript video tutorials?
WHY
Creating charts in javascript is very rewarding but extremely challenging. The Chart JS library made it easier to render charts. However the chart js documentation is hard to understand for many. It requires a lot of different moving parts to work along. The canvas tag, javascript, arrays and Chart JS all need to be combined to draw an eye catching bar chart or line chart.
The videos explains the chart js documentation in a more visual and easy to understand way. You can follow along with the code and quickly grasp how it works. We cover the code in chart js but also what truly happens and why something happens when we write a line of code. This fundamental understanding gives clarity to you as a developer in chartjs. In short it is the Chart JS video documentation.
HOW
We answer questions from YOU (viewers) by creating an answer video that covers the questions YOU have posted in the comment section.
WHAT
Our goal is to help YOU learn how to draw charts in Chart JS by showing you in video format how to do it.
Chart JS Video Documentation Site: https://www.chartjs3.com
▬ Chart JS 3.9.1 ▬▬▬▬▬▬▬▬▬▬▬▬
Chart JS is a javascript library to draw charts in the canvas tag on your site. Presenting data in a visual manner such as charts is more effective and appealing. All the charts are always coded in the latest Chartjs version which is as of this recording Chart JS 3.9.1.
What type of charts can you make with Chart.JS?
With chart js you can make line chart, bar chart, pie chart, doughnut chart, scatter chart, polar area chart, radar chart, gauge chart and area chart. And with some clever tricks and visual adjustment more can be done.
Тэги:
#how_to_create_horizontal_scroll_bar_with_fixed_y_scale_in_chart_js #create_horizontal_scroll_bar_with_fixed_y_scale_in_chart_js #horizontal_scroll_bar_with_fixed_y_scale_in_chart_js #chart_js #chartjs #chart.js #chart_js_tutorial #chartjs_3 #chart_js_3 #chart.js_3 #chartjs_3.9.1 #chart_js_3.9.1 #chart.js_3.9.1Комментарии:

Your videos are absolutely great and helpful. I would be grateful if you could just help me with one thing. I've tried to use above method with stack line graph. Then all of a sudden between fixed y axis and original chart1's y axis a slim margin appears. It's very narrow margin so almost unnoticeable but still it would be nice if you could advice on how to remove this small margin. By the way I'm using most recent version of chart js.
Ответить
Honestly, these videos are out of this world. Thanks for sharing your knowledge.
Ответить
interestigns approach. Would it be possible to know what X data range is currently in view and update it during scroll to demonstrate it additionally to user as a label ?
Ответить
too long video. Chart JS should give an option to manage this horizontal scroll instead doing all this stuff.
Ответить
Почему такой колхоз, мне ведь просто нужен скролл...
Ответить
Hi! Thanks for the help. Do you know how can I leave the chart at the end of the data? I mean, at the end of the scroll so I can see the last value the first time I get the chart and then scroll to the first value?
Ответить
Is it a responsive?
Ответить
Working fine but in one case it working odd ,
When we have x axis labels insted of mon,Tue.... ,. If we have large strings in that case y axis going down chart going up.
Please help

How do we create vertical scroll
Ответить
@Chart Js how can we create fixed y axis with horizontal scroll bar with single chart only instead of rendering two chart....if we have more data it will create performance issue right?
Ответить
thanks dude u made my life easy
Ответить
Woooww wooowww woowwww simply wooowwww...... that's has made my life super excited....i love you man I really do
Ответить


