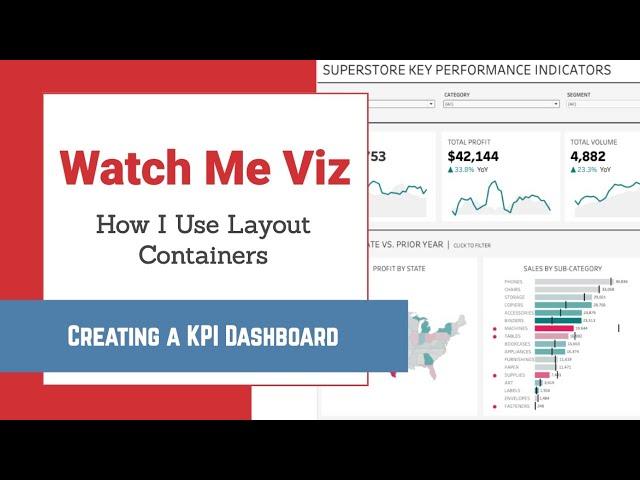
Mastering Containers in Tableau (Part 1) - Social Media KPI Dashboard
Комментарии:

I don't understand why it's better to create that floating container as a start VS. adding a tiled container as a start? :) I've watched this and Curtis's videos and tested both out myself, and I still don't get it 😮💨
Ответить
Fantastic, thank you Andy. Lesson completed.
Ответить
This is really great, and i am your big fan! if i stuck in tableau i watch your videos..In this vedio you have mentioned the first complex dashboard which you told that you will make it in another video. I am waiting for that curiously!
Your Obedient Subscriber/ Student/ Fan
Zubair

HI Andy
Really great . Thank you so much for doing very useful videos.
Ca you share me the "SUPERSTORE KEY PERFORMACE INDICATOR" Video ?
Thanks
Naresh

Thanks for the video! However when I bring in a KPI to the caption I am showing both +ve and -ve %'s for my dashboard. Is there a trick to show either +ve or -ve %. i.e +ve if +ve and -ve if -ve? Thanks again!
Ответить
@Andy Kriebel where can I find the Superstore Key Performance Indicators Workbook?
Ответить
This was really great, I have been struggling with container alignment and padding, thank you.
Ответить
Thanks a lot for your insights to layout containers. Just a side note: no one is going to memorize -2.9% and by heart knowing what the difference between -3% and -2.9% is. In most cases you will not need decimals in percentages.
Ответить
your "SUPERSTORE KEY PERFORMANCE INDICATORS" dashboard in this video has turned blank when i downloaded from Tableau Public today, i guess its because right now the year is 2021 and max date of data is 2020/12/31, but i dont know how to fix it?
Ответить
How do you get the caption to only show either the + or - % chg?
Ответить
Unless I missed something, at this point tableau should have built a feature that allows you to reorder containers on the left under layout
Ответить
where is the link to this tableau dashboard?
Ответить
Thank you, Andy! Much clicking but perfect result.
Ответить
Thank you for sharing this !
Ответить
Very nicely explained
Ответить
Very nice
Ответить
It's new thing to learn... Thank you
Ответить


