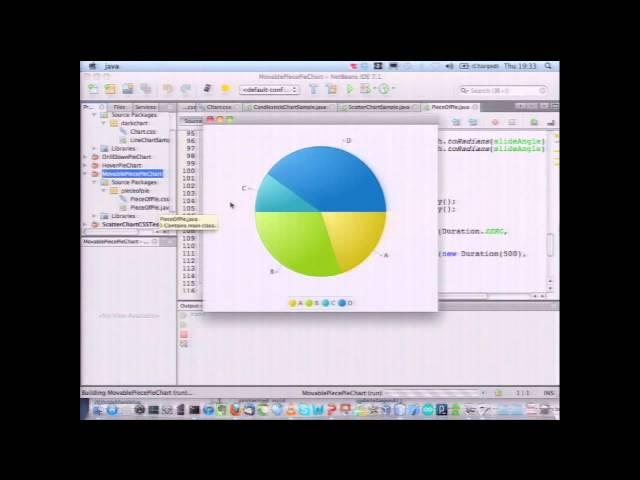
Custom Charts
Using chart components is a great way to enable data visualization and reporting. The JavaFX platform provides the very convenient, simple, and extensible Charts API for creating charts. Animation, CSS styling, dynamic charts, and axis autoranging are all built-in features of Charts. This session shows how easy it is to extend the API and create new chart and axis types that integrate well inside a JavaFX application. It also covers how to use CSS styling to create some awesome-looking charts.
Copyright © 2013 Oracle and/or its affiliates. Oracle® is a registered trademark of Oracle and/or its affiliates. All rights reserved. Oracle disclaims any warranties or representations as to the accuracy or completeness of this recording, demonstration, and/or written materials (the "Materials"). The Materials are provided "as is" without any warranty of any kind, either express or implied, including without limitation warranties of merchantability, fitness for a particular purpose, and non-infringement.
Copyright © 2013 Oracle and/or its affiliates. Oracle® is a registered trademark of Oracle and/or its affiliates. All rights reserved. Oracle disclaims any warranties or representations as to the accuracy or completeness of this recording, demonstration, and/or written materials (the "Materials"). The Materials are provided "as is" without any warranty of any kind, either express or implied, including without limitation warranties of merchantability, fitness for a particular purpose, and non-infringement.
Тэги:
#Java #JavaOne #2012 #JavaFX #CSS #Charts #animation #styling #dynamic_charts #axis_autorangingКомментарии:

@tienlonghungson - 14.06.2020 19:18
can u share the code for the candlestick chart ??? Thank you very much !!!
Ответить
@gunjanthesystem - 02.02.2015 21:33
Any help on creating Histograms using JavaFX... Is it possible to do with BarChart or do we need to extend XYChart... if yes...then kindly suggest.
Thanks,
Gunjan
Custom Charts
Oracle Learning
Два салата к шашлыку. Рецепт вкусных салатов.
КУХНЯ С АКЦЕНТОМ
ADDRESSABLE FIRE ALARM SYSTEM WIRING DIAGRAM /CONNECTION
KALUTEC POWER SOLUTIONS
How to react to sudden cardiac arrest
Philips Healthcare
Wycinarka do styropianu część 1
dooshek


![[FREE] 34murphy x Houdi Type Beat - "VICES" [FREE] 34murphy x Houdi Type Beat - "VICES"](https://invideo.cc/img/upload/UUFnVTdEdjBrcVY.jpg)


