Комментарии:

Aditya ms - 16.11.2021 19:45
Hi
I just love your work on this, but how do I get access to the code ?

Manikandan Devadoss - 12.04.2021 23:11
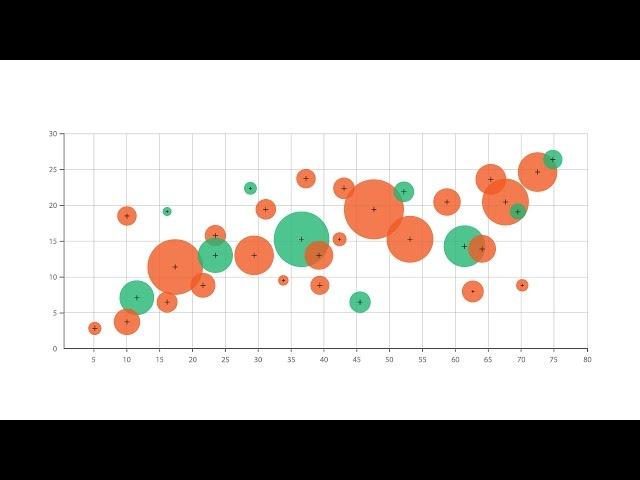
Hi thanks for the video. I have a question. How to draw a line chart over this bubble chart. X axis values will be same but y axis values will be different for the line chart. Thanks in advance.
Ответить
pointjabber - 15.01.2019 19:11
Excellent video. Thanks.
When the bubbles overlap, how do you fix it? Even if I limit them to 10, its tough to clearly see each.
In my use case, I need to share them in PDF/Image, so can't have tool tips.

Aline de Almeida Ribeiro - 25.10.2018 19:41
Thank you for the video! I will take a look at your website.
Ответить
Chinmay Chandak - 21.11.2017 15:37
thanks for the video
Ответить
A Guide to Bubble Charts
The DataViz Cat
Warbonnet Blackbird XLC Hammock - Overview, Setup, and Review
Backyard Kayaking & Camping
Обучаюсь водить ВОЕННЫЙ грузовик. Открыла категорию С
Настя ЧПЕК Туман
How to Make Instagram Stories Like a Pro with Adobe Express | Adobe Creative Cloud
Adobe Creative Cloud
TKO Fire Extinguisher mount - roll bar & other accessories
Beyond The Raptor
responding to hate comments
Nailea Devora
Les 6 meilleurs workflows HubSpot pour votre acquisition digitale
Pilot'in - Agence digitale et créative


