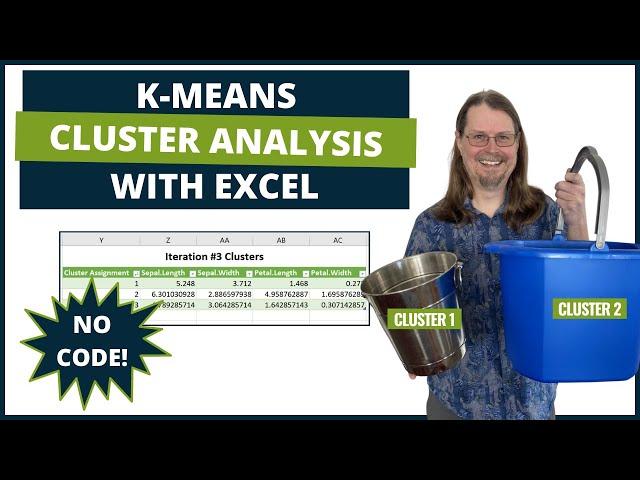
K-means Cluster Analysis With Excel - A Tutorial
Комментарии:

Hello! May I ask how the end results can be put into a graph for visualization to show the actual result of the clustering? Trying to search online but I can't seem to find one that aligns to this method.
Very informative tutorial on the groundwork though to understand the foundations. :)

Hello, great video! Do you have a video showing how you would do this using R?
Ответить
Just fantastic explanations and approach. Thanks for sharing this.
Ответить
You mentioned that for categorical data there are better alternatives for cluster analysis - what would you recommend please?
Ответить
Hey, I have a media data set in which, Rows are episode names and Columns are the different slot timings, So Let's say episode A has data for only 3 slots, and Episode B has data for 4 slots and so on. How do I apply K means to this Data set?
Ответить
You gained a new subscriber now thanks Dave
Ответить
Great Video.
Suggestion1
If in the iteration 1 you calculate de sum of the minimum distances. After that, you use the "excel->Data->Solver" to find your minimum of that sum by changing your initial points. With that, excel will do all the work for you in a glance.

Thanks Dave, Got it.
Ответить
Prima, vielen Dank! Konnte nun mein eigenes Programm mit VB zur flexiblen Clusterbildung beliebiger Wertepaare schreiben. Die Daten (x, y) übernehme ich zunächst aus der Tabelle in ein Array. Dieses lasse ich dann mit verschachtelten Schleifen n-mal (=Iterationen) durchlaufen, bis alle Wertepaare auf Basis der kürzesten Entfernungen einem Cluster(-Punkt) zugeordnet sind, ohne das weitere Schleifendurchläufe diese Zuordnungen verändern. Es erfolgt der Ausstieg aus den Schleifen. Die Clusternummern werden dann auf einen Schlag in die Quelltabelle, in eine neue Spalte eingefügt. Fertig! Das geht alles blitzschnell und ohne die vielen, doch ziemlich aufwendigen Tabellen und Formeln, die Du im zweiten Teil Deines Tutorials zeigst. Dazu kommt, dass ich mein k-Mean-Programm universell nutzen kann. Es ist gleich, welche (numerischen) Datenspalten einlesen und clustern kann.
Great. Thanks! I was now able to write my own program with VB for flexible clustering of any pairs of values. First, I take the data (x, y) from the table into an array. I then run this through nested loops n times (=iterations) until all pairs of values are assigned to a cluster (point) based on the shortest distances, without further loop runs changing these assignments. There is an exit from the loops. The cluster numbers are then inserted in one fell swoop into a new column in the source table. Finished! It's all lightning fast and without the many, but rather complex tables and formulas that you show in the second part of your tutorial. In addition, I can use my k-mean program universally. It doesn't matter which (numeric) data columns can read and cluster.

You're my Hero. God bless you 🤝
Ответить
Hi David, great video!!! today there are several new formulas, xlookup is an amazing and much easier way than vlookup. and for you huge and monster formula use the SUMXMY2 function. To find the average of each cluster (top rows) use the averageif formula... muuuuch easier and skip the power query step. Finnaly you shouldt run a min solver in order to find the min distance among variables and centroids.
Ответить
One of the best lecture on k-means ..if you were in front of me i would have kissed you ..Greetings from India
Ответить
In k means clustering, is there an assumption in numbers of observations and variables? Would having variables greater than observation affect the results of clustering and make it less accurate?
Ответить
This was an awesome video!
Ответить
Hello! Thanks for the detailed explanation. But, do you have the same, but fully based on PowerQuery?
Initially, I want to try the same, but with ~2 million (lines) of customers, and >50 columns (dimensions). I think VLOOKUping them is not an optimal way to do that (
Or, my best alternative is to switch to R / Python with these volumes?

Thanks!!! I learned a lot with your video :)
Ответить
David
Thanks for the clip, very useful and informative.
May I suggest to have one for Mixed Data (Category and numeric data? I have been searching it for ages but in vain.
Thanks for your help

This is such a great tutorial. I've been trying to do this all week (started in python but came back to Excel) and this is exactly what I needed. Really thorough, lots to think about and still easy to follow!
Ответить
this video is awesome, thank you David!
Ответить
Thank you Dave for this video! It was interesting and your explanation is really clear and useful =)
Ответить


